OPEN-SOURCE SCRIPT
For Vietnamese: 3D Volume Weighted Liquidity Level
Introduction
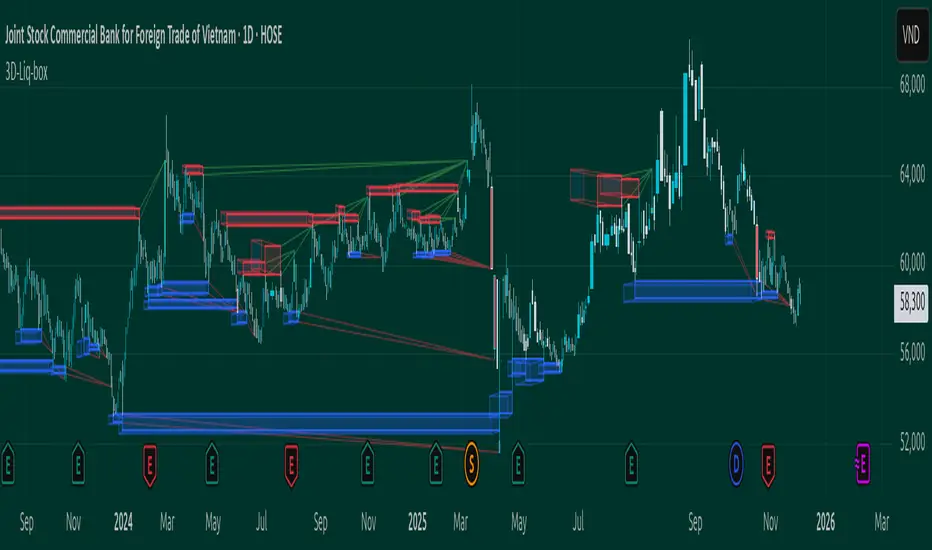
The 3D Volume Weighted Liquidity Level indicator visualizes market structure by identifying key support and resistance zones based on Pivot Highs and Lows. Unlike standard support/resistance lines, this tool adds a "3D" dimension by calculating the depth of the zone based on Accumulated Volume and Volatility (ATR). This helps traders visualize the "weighted" or significance of a specific price level.
Key Features
- 3D Visualization: Draws geometric boxes connecting similar Pivot points to create clear structural zones.
- Volume & Volatility Depth: The height (depth) of the box is not random. It is calculated dynamically using the accumulated volume between pivots multiplied by the ATR. Thicker boxes imply higher volume accumulation and volatility at that level.
- Liquidity Grab Detection: The indicator automatically detects and highlights bars that "grab liquidity" (break the top of a resistance box or the bottom of a support box), signaling potential stop hunts or reversals.
- Customizable Sensitivity: Users can adjust pivot lengths, search depth, and the volume scaling factor to fit different timeframes and assets.
How to Use
- Support & Resistance: Use the Blue Boxes as potential Support zones and Red Boxes as potential Resistance zones.
- Trend Reversals: Watch for the Liquidity Grab signals (colored bars). If price pierces a box but fails to close significantly beyond it, it often indicates a trap or a reversal setup.
- Volume Analysis: Pay attention to the thickness of the boxes. A thicker box suggests that a significant amount of volume was traded to form that structure, making it a stronger level of interest.
The 3D Volume Weighted Liquidity Level indicator visualizes market structure by identifying key support and resistance zones based on Pivot Highs and Lows. Unlike standard support/resistance lines, this tool adds a "3D" dimension by calculating the depth of the zone based on Accumulated Volume and Volatility (ATR). This helps traders visualize the "weighted" or significance of a specific price level.
Key Features
- 3D Visualization: Draws geometric boxes connecting similar Pivot points to create clear structural zones.
- Volume & Volatility Depth: The height (depth) of the box is not random. It is calculated dynamically using the accumulated volume between pivots multiplied by the ATR. Thicker boxes imply higher volume accumulation and volatility at that level.
- Liquidity Grab Detection: The indicator automatically detects and highlights bars that "grab liquidity" (break the top of a resistance box or the bottom of a support box), signaling potential stop hunts or reversals.
- Customizable Sensitivity: Users can adjust pivot lengths, search depth, and the volume scaling factor to fit different timeframes and assets.
How to Use
- Support & Resistance: Use the Blue Boxes as potential Support zones and Red Boxes as potential Resistance zones.
- Trend Reversals: Watch for the Liquidity Grab signals (colored bars). If price pierces a box but fails to close significantly beyond it, it often indicates a trap or a reversal setup.
- Volume Analysis: Pay attention to the thickness of the boxes. A thicker box suggests that a significant amount of volume was traded to form that structure, making it a stronger level of interest.
Script de código aberto
Em verdadeiro espírito do TradingView, o criador deste script o tornou de código aberto, para que os traders possam revisar e verificar sua funcionalidade. Parabéns ao autor! Embora você possa usá-lo gratuitamente, lembre-se de que a republicação do código está sujeita às nossas Regras da Casa.

MikeJSaylor @ telegram
Aviso legal
As informações e publicações não se destinam a ser, e não constituem, conselhos ou recomendações financeiras, de investimento, comerciais ou de outro tipo fornecidos ou endossados pela TradingView. Leia mais nos Termos de Uso.
Script de código aberto
Em verdadeiro espírito do TradingView, o criador deste script o tornou de código aberto, para que os traders possam revisar e verificar sua funcionalidade. Parabéns ao autor! Embora você possa usá-lo gratuitamente, lembre-se de que a republicação do código está sujeita às nossas Regras da Casa.
MikeJSaylor @ telegram
Aviso legal
As informações e publicações não se destinam a ser, e não constituem, conselhos ou recomendações financeiras, de investimento, comerciais ou de outro tipo fornecidos ou endossados pela TradingView. Leia mais nos Termos de Uso.