Overview
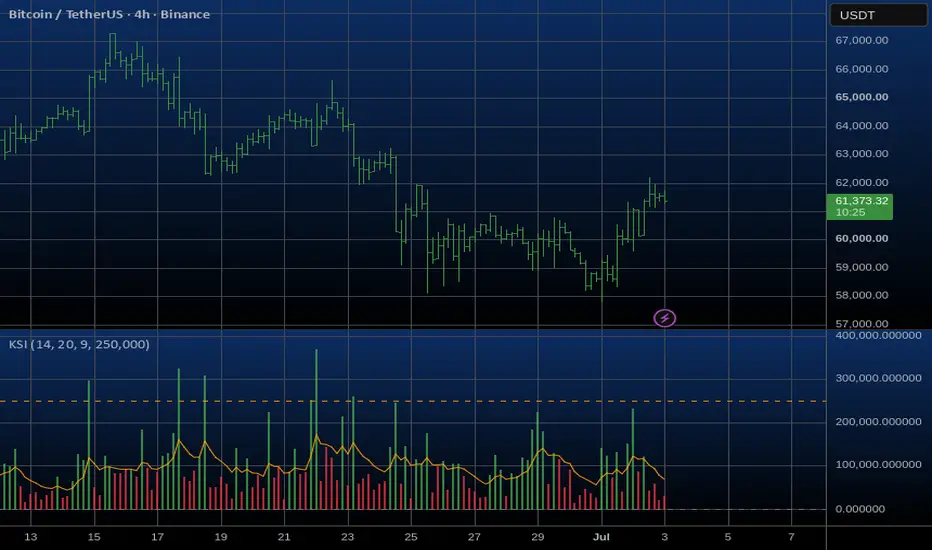
The Kinetic Slippage Index (KSI) is an advanced volume-volatility oscillator designed to measure market efficiency—or the lack thereof. Inspired by order book microstructure and liquidity gaps, KSI calculates the "cost of price movement." It helps traders identify hidden institutional distribution, retail exhaustion, and high-probability false breakouts.
Unlike standard momentum oscillators (RSI, Stochastic) that only track price speed, KSI analyzes how much raw volume was required to achieve a specific price range.
The Theoretical Concept
In a highly liquid and efficient market, large trading volumes are absorbed by dense limit orders, causing the price to move smoothly and tightly.
However, when liquidity clears out (an "empty order book" or "liquidity vacuum"), even a small market order can cause a massive price jump. This phenomenon is called slippage.
KSI mathematically captures this by squaring the True Range and dividing it by the current Volume and its long-term EMA.
- High KSI: Price is flying or dropping fast, but on critically low volume. The market is "hollow."
- Low KSI: Enormous volume is pouring in, but the price is compressed into tight bars. Heavy institutional absorption is taking place.
How to Trade with KSI (Key Use Cases)
1. Fading False Breakouts (The "SPIKE" Signal)
- Scenario: The price breaks out of a key resistance or support level, creating a new local high/low.
- KSI Behavior: A purple "SPIKE" marker appears, meaning KSI has crossed above the critical threshold.
- Interpretation: The breakout is happening on a "hollow" market without institutional backing. It is highly likely a liquidity hunt (stop-run).
- Strategy: Look for a reversal pattern on the price chart and trade against the breakout (Fade).
2. Trend Exhaustion & Climax
- Scenario: The asset is in a strong, prolonged trend. Suddenly, a massive price bar occurs in the direction of the trend.
- KSI Behavior: KSI prints a series of extreme high histogram bars or triggers a "SPIKE" alert.
- Interpretation: This is a buying/selling climax (exhaustion). Smart money is withdrawing their limit orders, letting late retail buyers push the price into a vacuum right before the crash.
- Strategy: Tighten trailing stops on current positions or prepare for a counter-trend setup.
3. Institutional Accumulation / Compression
- Scenario: Price enters a tight, boring consolidation (flat).
- KSI Behavior: The histogram bars turn red and get tightly compressed near the zero line, staying significantly below the orange Signal Line.
- Interpretation: Huge trading volume is being injected, but the price isn't moving. Big players are quietly accumulating or distributing positions using iceberg orders.
- Strategy: Do not trade inside this zone. Prepare for a massive, explosive breakout. Wait for the KSI histogram to flip green and cross above the Signal Line to confirm the direction.
Inputs & Customization
- ATR / Range Period (Default: 14): Controls the lookback window for measuring the price range.
- Volume EMA Period (Default: 20): Smooths out volume to create a reliable benchmark for average liquidity.
- Signal Line Period (Default: 9): An EMA of the KSI itself, used to detect shorter-term shifts in momentum (Green/Red histogram flips).
- Spike Signal Level (Default: 50000): Critical value line for alerts.
The Kinetic Slippage Index (KSI) is an advanced volume-volatility oscillator designed to measure market efficiency—or the lack thereof. Inspired by order book microstructure and liquidity gaps, KSI calculates the "cost of price movement." It helps traders identify hidden institutional distribution, retail exhaustion, and high-probability false breakouts.
Unlike standard momentum oscillators (RSI, Stochastic) that only track price speed, KSI analyzes how much raw volume was required to achieve a specific price range.
The Theoretical Concept
In a highly liquid and efficient market, large trading volumes are absorbed by dense limit orders, causing the price to move smoothly and tightly.
However, when liquidity clears out (an "empty order book" or "liquidity vacuum"), even a small market order can cause a massive price jump. This phenomenon is called slippage.
KSI mathematically captures this by squaring the True Range and dividing it by the current Volume and its long-term EMA.
- High KSI: Price is flying or dropping fast, but on critically low volume. The market is "hollow."
- Low KSI: Enormous volume is pouring in, but the price is compressed into tight bars. Heavy institutional absorption is taking place.
How to Trade with KSI (Key Use Cases)
1. Fading False Breakouts (The "SPIKE" Signal)
- Scenario: The price breaks out of a key resistance or support level, creating a new local high/low.
- KSI Behavior: A purple "SPIKE" marker appears, meaning KSI has crossed above the critical threshold.
- Interpretation: The breakout is happening on a "hollow" market without institutional backing. It is highly likely a liquidity hunt (stop-run).
- Strategy: Look for a reversal pattern on the price chart and trade against the breakout (Fade).
2. Trend Exhaustion & Climax
- Scenario: The asset is in a strong, prolonged trend. Suddenly, a massive price bar occurs in the direction of the trend.
- KSI Behavior: KSI prints a series of extreme high histogram bars or triggers a "SPIKE" alert.
- Interpretation: This is a buying/selling climax (exhaustion). Smart money is withdrawing their limit orders, letting late retail buyers push the price into a vacuum right before the crash.
- Strategy: Tighten trailing stops on current positions or prepare for a counter-trend setup.
3. Institutional Accumulation / Compression
- Scenario: Price enters a tight, boring consolidation (flat).
- KSI Behavior: The histogram bars turn red and get tightly compressed near the zero line, staying significantly below the orange Signal Line.
- Interpretation: Huge trading volume is being injected, but the price isn't moving. Big players are quietly accumulating or distributing positions using iceberg orders.
- Strategy: Do not trade inside this zone. Prepare for a massive, explosive breakout. Wait for the KSI histogram to flip green and cross above the Signal Line to confirm the direction.
Inputs & Customization
- ATR / Range Period (Default: 14): Controls the lookback window for measuring the price range.
- Volume EMA Period (Default: 20): Smooths out volume to create a reliable benchmark for average liquidity.
- Signal Line Period (Default: 9): An EMA of the KSI itself, used to detect shorter-term shifts in momentum (Green/Red histogram flips).
- Spike Signal Level (Default: 50000): Critical value line for alerts.
Notas de Lançamento
Changes:1) Inputs & Customization
- Spike Signal Level (Default: 0): Critical value line for alerts.
The signal line is set to 0 by default. To correctly scale the histogram upon first use, change this value to the desired value in the indicator settings.
2) Precision
Precision has been increased to 6
Script de código aberto
Em verdadeiro espírito do TradingView, o criador deste script o tornou de código aberto, para que os traders possam revisar e verificar sua funcionalidade. Parabéns ao autor! Embora você possa usá-lo gratuitamente, lembre-se de que a republicação do código está sujeita às nossas Regras da Casa.

Aviso legal
As informações e publicações não se destinam a ser, e não constituem, conselhos ou recomendações financeiras, de investimento, comerciais ou de outro tipo fornecidos ou endossados pela TradingView. Leia mais nos Termos de Uso.
Script de código aberto
Em verdadeiro espírito do TradingView, o criador deste script o tornou de código aberto, para que os traders possam revisar e verificar sua funcionalidade. Parabéns ao autor! Embora você possa usá-lo gratuitamente, lembre-se de que a republicação do código está sujeita às nossas Regras da Casa.
Aviso legal
As informações e publicações não se destinam a ser, e não constituem, conselhos ou recomendações financeiras, de investimento, comerciais ou de outro tipo fornecidos ou endossados pela TradingView. Leia mais nos Termos de Uso.