NYSE -TICK Cluster Low
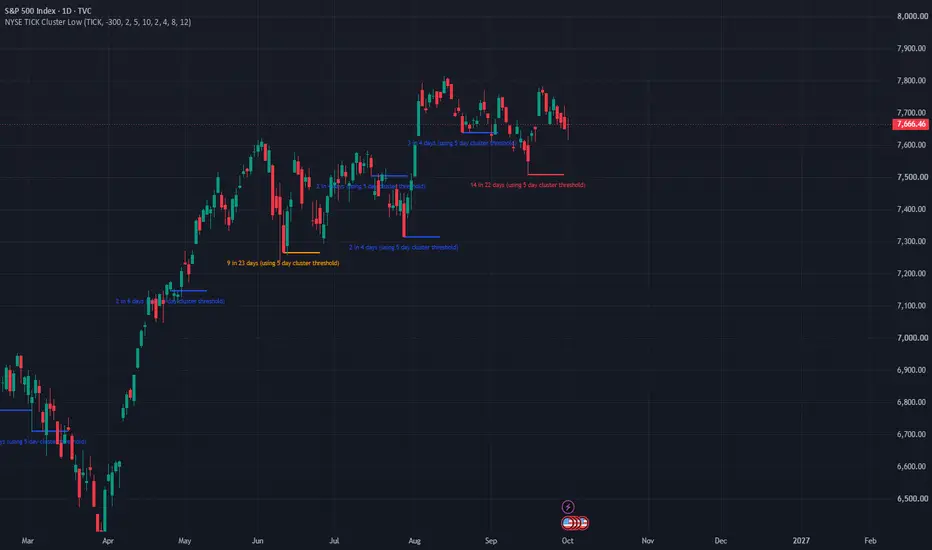
This indicator finds stretches of days when the NYSE TICK closes at an extreme low, then marks the lowest price point of that stretch on your chart.
How it works
It pulls the daily close of USI:TICK and flags any day where it closes at or below your threshold (default -300).
Flagged days are chained into a cluster. A new flagged day joins the current cluster if it lands within the cluster threshold (default 5 bars) of the previous flagged day. If the gap is larger, a new cluster starts.
Once a cluster has at least the minimum number of flagged days (default 2), it draws a horizontal line at the lowest low of the chart symbol during that cluster. The line extends forward 10 bars from the bar where that low occurred.
The line is redrawn each time a new flagged day is added, so it always reflects the cluster's lowest low so far.
Color tiers
The line and label color escalate with cluster size: yellow at 4+ flagged days, orange at 8+, and red at 12+. Clusters of 2 to 3 use the base line color (red by default). All tier sizes and colors are adjustable inputs.
Label
Under each line you'll see text like 5 in 9 days (using 5 day cluster threshold): the number of flagged days, the number of candles from the first flagged day to the most recent one, and your current cluster threshold setting.
Intended use
Heavy, repeated selling pressure (very negative TICK readings) often clusters near short-term lows. The lines give you reference levels to watch as potential support, with color showing how intense the selling was.
Caveat: It's built for daily charts. On intraday timeframes, the daily TICK close is repeated across every bar of the day, so a single extreme day would register as many signals and inflate the counts. If you want to use it intraday, the logic would need to be changed to count each day only once.
How it works
It pulls the daily close of USI:TICK and flags any day where it closes at or below your threshold (default -300).
Flagged days are chained into a cluster. A new flagged day joins the current cluster if it lands within the cluster threshold (default 5 bars) of the previous flagged day. If the gap is larger, a new cluster starts.
Once a cluster has at least the minimum number of flagged days (default 2), it draws a horizontal line at the lowest low of the chart symbol during that cluster. The line extends forward 10 bars from the bar where that low occurred.
The line is redrawn each time a new flagged day is added, so it always reflects the cluster's lowest low so far.
Color tiers
The line and label color escalate with cluster size: yellow at 4+ flagged days, orange at 8+, and red at 12+. Clusters of 2 to 3 use the base line color (red by default). All tier sizes and colors are adjustable inputs.
Label
Under each line you'll see text like 5 in 9 days (using 5 day cluster threshold): the number of flagged days, the number of candles from the first flagged day to the most recent one, and your current cluster threshold setting.
Intended use
Heavy, repeated selling pressure (very negative TICK readings) often clusters near short-term lows. The lines give you reference levels to watch as potential support, with color showing how intense the selling was.
Caveat: It's built for daily charts. On intraday timeframes, the daily TICK close is repeated across every bar of the day, so a single extreme day would register as many signals and inflate the counts. If you want to use it intraday, the logic would need to be changed to count each day only once.

Aviso legal
As informações e publicações não se destinam a ser, e não constituem, conselhos ou recomendações financeiras, de investimento, comerciais ou de outro tipo fornecidos ou endossados pela TradingView. Leia mais nos Termos de Uso.
Aviso legal
As informações e publicações não se destinam a ser, e não constituem, conselhos ou recomendações financeiras, de investimento, comerciais ou de outro tipo fornecidos ou endossados pela TradingView. Leia mais nos Termos de Uso.