[DAOL] Recovery Clock
⏺️ What is it?
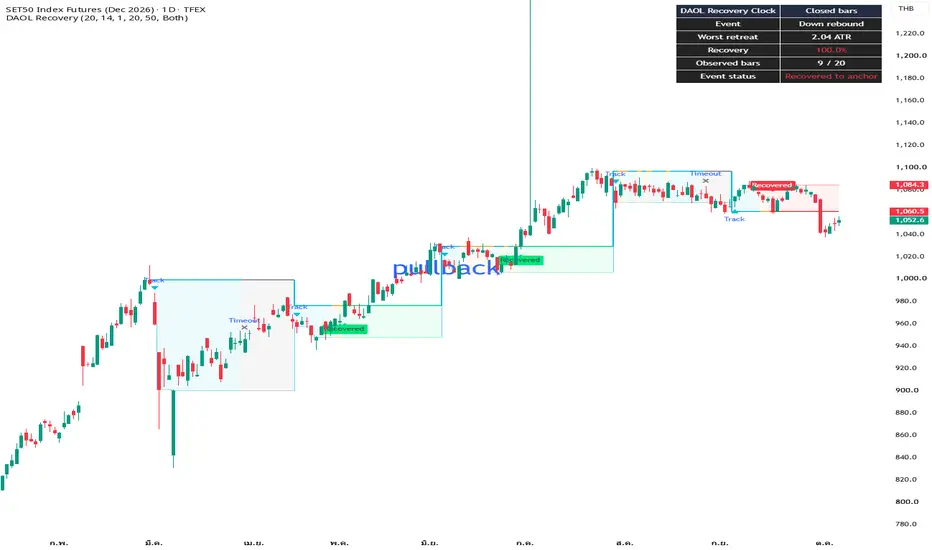
[DAOL] Recovery Clock tracks individual price-retreat events and measures how much of the retreat has been recovered over time.
For an upward event, it observes a pullback from a recent closing-price high and tracks recovery toward that high.
For a downward event, it observes a rebound from a recent closing-price low and tracks the return toward that low.
🔹 Depth — the largest closing-price retreat, expressed in ATR units
🔹 Recovery — the percentage of that retreat restored by the latest close
🔹 Observed Bars — the number of closed bars since the event started
⏺️ Indicator นี้คืออะไร?
[DAOL] Recovery Clock คือเครื่องมือติดตามการถอยของราคาเป็นรายเหตุการณ์ โดยดูทั้ง ระยะที่ฟื้นคืนและเวลาที่ผ่านไป
ฝั่งขึ้นจะติดตามการย่อจากยอดราคาปิด แล้ววัดการฟื้นกลับไปหายอดเดิม
ฝั่งลงจะติดตามการเด้งจากจุดต่ำของราคาปิด แล้ววัดการกลับลงไปหาจุดต่ำเดิม
🔹 Depth — ระยะถอยมากที่สุดจากราคาปิด แสดงเป็นจำนวน ATR
🔹 Recovery — เปอร์เซ็นต์ของระยะถอยที่ราคาปิดล่าสุดคืนกลับมา
🔹 Observed Bars — จำนวนแท่งปิดตั้งแต่เริ่มเหตุการณ์
⏺️ Why use Recovery Clock?
🔹 Separates retreat depth from recovery duration
🔹 Shows whether price has restored part or all of a retreat
🔹 Uses a fixed reference level throughout each event
🔹 Provides context for pullback and rebound analysis
Two events can have the same retreat depth but different recovery paths and durations. Recovery Clock displays these measurements separately rather than combining them into a single score.
⏺️ ทำไมต้องใช้?
🔹 แยกให้เห็นว่าถอยลึกแค่ไหน และผ่านไปนานเท่าไร
🔹 แสดงว่าราคาคืนระยะกลับมาแล้วบางส่วนหรือทั้งหมด
🔹 ใช้ระดับอ้างอิงเดิมตลอดแต่ละเหตุการณ์
🔹 ใช้ประกอบการวิเคราะห์การย่อและการเด้งของราคา
เหตุการณ์สองครั้งอาจถอยลึกเท่ากัน แต่ฟื้นคืนในจังหวะและเวลาที่ต่างกัน ตัวนี้จึงแสดงแต่ละองค์ประกอบแยกกัน เพื่อให้ตีความได้ตรงไปตรงมา
⏺️ Who should use it?
🔹 Traders monitoring pullbacks and rebounds
🔹 Day traders and swing traders observing recovery toward previous closing-price extremes
🔹 Technical analysts comparing retreat depth with elapsed time
🔹 Users seeking price-based event tracking without a volume requirement
⏺️ เหมาะกับใคร?
🔹 Trader ที่ติดตามการย่อหรือการเด้งของราคา
🔹 Day trader และ Swing trader ที่ดูการกลับไปหาระดับราคาปิดเดิม
🔹 นักวิเคราะห์ที่ต้องการอ่านระยะถอยร่วมกับเวลาที่ผ่านไป
🔹 ผู้ใช้ที่ต้องการติดตามเหตุการณ์จากราคา โดยไม่ต้องใช้ Volume
⏺️ How does it work?
Arm a reference when the close exceeds the highest close, or falls below the lowest close, of the preceding 20 bars.
Before an event starts, a newer qualifying extreme replaces the armed reference.
Start an event when the closing-price retreat reaches at least 1 current ATR.
Freeze the reference price and ATR at event start.
Track the worst adverse close, recovery percentage, and elapsed bars.
End the event when the close reaches the reference price or the observation reaches 20 bars.
Only one reference is armed and one event is tracked at a time. In “Both” mode, a newer opposite extreme can replace the reference before an event starts.
An armed reference expires if no event starts within 20 bars after it was recorded.
⏺️ ทำงานอย่างไร?
เตรียมระดับอ้างอิงเมื่อราคาปิดสูงกว่าราคาปิดสูงสุด หรือต่ำกว่าราคาปิดต่ำสุดของ 20 แท่งก่อนหน้า
ก่อนเริ่มเหตุการณ์ หากเกิดจุดสุดขั้วใหม่ที่เข้าเกณฑ์ จะเปลี่ยนระดับอ้างอิงตาม
เริ่มติดตามเมื่อราคาปิดถอยจากระดับอ้างอิงอย่างน้อย 1 ATR ณ แท่งนั้น
ล็อกราคาอ้างอิงและค่า ATR เมื่อเริ่มเหตุการณ์
ติดตามราคาปิดที่ถอยมากที่สุด เปอร์เซ็นต์ฟื้นคืน และจำนวนแท่งที่ผ่านไป
จบเมื่อราคาปิดกลับถึงระดับอ้างอิง หรือครบ 20 แท่งติดตาม
ระบบเตรียมระดับอ้างอิงและติดตามเหตุการณ์ทีละหนึ่งชุด ในโหมด “Both” จุดสุดขั้วใหม่ฝั่งตรงข้ามสามารถแทนระดับอ้างอิงเดิมได้ก่อนเริ่มเหตุการณ์
หากยังไม่เกิดเหตุการณ์ภายใน 20 แท่งหลังบันทึกระดับอ้างอิง ระดับนั้นจะหมดอายุ
⏺️ Understanding the measurements
Depth (ATR) = Largest Closing-Price Retreat ÷ ATR Frozen at Event Start
Recovery (%) = Restored Distance from the Worst Event Close ÷ Largest Closing-Price Retreat × 100
Example:
🔹 Reference high = 100
🔹 Worst event close = 96
🔹 Latest close = 99
🔹 Recovery = (99 − 96) ÷ (100 − 96) × 100 = 75%
For a downward event, the calculation is reversed to measure the return from the rebound high toward the reference low.
Recovery is capped between 0% and 100%. If a new adverse closing extreme occurs, recovery can fall back to zero.
⏺️ ตัวเลขหมายถึงอะไร?
Depth (ATR) = ระยะถอยมากที่สุดจากราคาปิด ÷ ค่า ATR ที่ล็อกไว้ตอนเริ่มเหตุการณ์
Recovery (%) = ระยะที่คืนกลับมาจากราคาปิดที่ถอยมากที่สุด ÷ ระยะถอยทั้งหมด × 100
ตัวอย่าง:
🔹 ยอดอ้างอิง = 100
🔹 ราคาปิดต่ำสุดระหว่างเหตุการณ์ = 96
🔹 ราคาปิดล่าสุด = 99
🔹 Recovery = (99 − 96) ÷ (100 − 96) × 100 = 75%
ฝั่งลงจะกลับด้านสูตร โดยวัดการกลับจากยอดเด้งไปหาจุดต่ำอ้างอิงเดิม
Recovery อยู่ระหว่าง 0% ถึง 100% หากเกิดราคาปิดที่ถอยมากที่สุดครั้งใหม่ ค่า Recovery สามารถกลับเป็นศูนย์ได้
Recovery 75% หมายถึงคืนระยะมาแล้ว 75% ไม่ใช่โอกาสกลับถึงระดับเดิม 75%
⏺️ How to read the colors
🔵 Blue — an event is active, with recovery below the partial-recovery threshold
🟡 Gold — an event is active, with recovery at or above the partial-recovery threshold
🟢 Green — an upward pullback event closes back at or above its reference high
🔴 Red — a downward rebound event closes back at or below its reference low
⚪ Gray — waiting for an event, or the observation has timed out
The default partial-recovery threshold is 50%.
Red indicates a completed return to the lower reference. It is not an automatic sell signal.
⏺️ อ่านสีอย่างไร?
🔵 ฟ้า — กำลังติดตาม และฟื้นคืนยังไม่ถึงเกณฑ์ Partial Recovery
🟡 ทอง — กำลังติดตาม และฟื้นคืนถึงเกณฑ์ Partial Recovery แล้ว
🟢 เขียว — เหตุการณ์ย่อฝั่งขึ้นกลับมาปิดถึงหรือเหนือยอดอ้างอิง
🔴 แดง — เหตุการณ์เด้งฝั่งลงกลับมาปิดถึงหรือต่ำกว่าจุดต่ำอ้างอิง
⚪ เทา — รอเหตุการณ์ หรือหมดเวลาติดตาม
ค่าเริ่มต้นของ Partial Recovery คือ 50%
สีแดงหมายถึงกลับถึงระดับอ้างอิงฝั่งล่างแล้ว ไม่ใช่คำสั่งขายโดยอัตโนมัติ
⏺️ How to use
🔹 Frozen Recovery Anchor — the reference price the event is trying to recover
🔹 Worst Event Close — the largest adverse closing-price excursion during the event
🔹 Shaded Area — the distance between those two levels
🔹 Track Marker — the start of an observation
🔹 Recovered Marker — the close reaches the reference
🔹 Timeout Marker — the observation expires before recovery
The dashboard displays event direction, worst retreat in ATR units, recovery percentage, observed bars, and event status.
The start bar counts as observation bar 1. The clock measures time since the retreat trigger—not time since the original high or low.
Completed results remain visible until another event starts.
⏺️ วิธีใช้งาน
🔹 Frozen Recovery Anchor — ระดับราคาอ้างอิงที่ใช้เป็นเป้าหมายการคืนระยะ
🔹 Worst Event Close — ราคาปิดที่ถอยมากที่สุดระหว่างเหตุการณ์
🔹 พื้นที่แรเงา — ระยะระหว่างระดับอ้างอิงกับราคาปิดที่ถอยมากที่สุด
🔹 Track — จุดเริ่มติดตาม
🔹 Recovered — ราคาปิดกลับถึงระดับอ้างอิง
🔹 Timeout — หมดเวลาก่อนกลับถึงระดับอ้างอิง
Dashboard แสดงทิศทาง ระยะถอยเป็น ATR เปอร์เซ็นต์ฟื้นคืน จำนวนแท่งที่ติดตาม และสถานะ
แท่งเริ่มเหตุการณ์นับเป็นแท่งที่ 1 โดยนาฬิกานับจากจุดที่ถอยถึงเกณฑ์ ไม่ได้นับจากแท่งที่เกิดยอดหรือจุดต่ำเดิม
ผลที่จบแล้วจะค้างไว้จนเริ่มเหตุการณ์ใหม่
⏺️ Default settings
🔹 Closing Extreme Lookback — 20 bars
🔹 ATR Length — 14
🔹 Retreat Trigger — 1.0 ATR
🔹 Maximum Observation — 20 bars, including the start bar
🔹 Partial Recovery — 50%
🔹 Track Direction — Both
Available direction modes:
🔹 Both
🔹 Up pullbacks
🔹 Down rebounds
A higher retreat trigger requires a larger move before observation starts. A longer observation window allows more time to recover the reference.
⏺️ ค่าเริ่มต้น
🔹 Closing Extreme Lookback — 20 แท่ง
🔹 ATR Length — 14
🔹 Retreat Trigger — 1.0 ATR
🔹 Maximum Observation — 20 แท่ง รวมแท่งเริ่มเหตุการณ์
🔹 Partial Recovery — 50%
🔹 Track Direction — Both
เลือกติดตามได้ 3 แบบ:
🔹 Both — ทั้งสองฝั่ง
🔹 Up pullbacks — การย่อจากยอด
🔹 Down rebounds — การเด้งจากจุดต่ำ
การเพิ่ม Retreat Trigger ทำให้ต้องถอยมากขึ้นก่อนเริ่มติดตาม ส่วนการเพิ่มช่วงติดตามทำให้มีเวลารอการกลับถึงระดับอ้างอิงมากขึ้น
⏺️ Alerts
🔹 Recovery observation started
🔹 First partial recovery
🔹 Up anchor recovered
🔹 Down anchor recovered
🔹 Recovery timed out
🔹 Any completed event
The partial-recovery alert fires at most once per event. It does not repeat if recovery falls and later crosses the threshold again.
If the reference is recovered on the final allowed bar, recovery takes priority over timeout.
To receive alerts, create an alert in TradingView, select the desired condition, and choose “Once Per Bar Close.”
⏺️ การแจ้งเตือน
🔹 Recovery observation started — เริ่มติดตามเมื่อถอยถึงเกณฑ์
🔹 First partial recovery — ผ่านเกณฑ์ฟื้นคืนบางส่วนครั้งแรก
🔹 Up anchor recovered — กลับถึงยอดอ้างอิง
🔹 Down anchor recovered — กลับถึงจุดต่ำอ้างอิง
🔹 Recovery timed out — หมดเวลาติดตาม
🔹 Any completed event — แจ้งเมื่อจบเหตุการณ์
Alert ฟื้นคืนบางส่วนแจ้งได้สูงสุดหนึ่งครั้งต่อเหตุการณ์ ไม่แจ้งซ้ำเมื่อค่าลดลงแล้วกลับมาผ่านเกณฑ์อีก
หากกลับถึงระดับอ้างอิงในแท่งสุดท้ายที่อนุญาต ระบบจะจัดเป็น Recovered ก่อนพิจารณา Timeout
หากต้องการรับ Alert ให้สร้างการแจ้งเตือนใน TradingView เลือกเงื่อนไขที่ต้องการ และตั้ง “Once Per Bar Close”
⏺️ Key Features
🔹 Event-based pullback and rebound tracking
🔹 Frozen reference price and ATR
🔹 Retreat depth expressed in ATR units
🔹 Recovery percentage and observation duration
🔹 Closed-bar markers and alerts
🔹 No future-bar references, hindsight pivots, or multi-timeframe requests
⏺️ จุดเด่น
🔹 ติดตามการย่อและการเด้งเป็นรายเหตุการณ์
🔹 ล็อกราคาอ้างอิงและ ATR เมื่อเริ่มติดตาม
🔹 แสดงระยะถอยด้วยหน่วย ATR
🔹 แสดงเปอร์เซ็นต์ฟื้นคืนและจำนวนแท่งที่ผ่านไป
🔹 มีสัญลักษณ์และ Alert จากแท่งปิด
🔹 ไม่ใช้แท่งอนาคต Pivot ที่รอข้อมูลย้อนหลัง หรือข้อมูลจาก Timeframe อื่น
⏺️ Concept and attribution
ATR is based on the work of J. Welles Wilder.
This independently written implementation uses ATR to normalize retreat depth, then tracks a fixed closing-price reference, the worst adverse close, recovery percentage, and elapsed bars.
It does not claim that drawdown, recovery ratios, or recovery duration are entirely new concepts.
Reference:
TradingView — Average True Range (ATR)
tradingview.com/support/solutions/43000501823-average-true-range-atr/
⏺️ แนวคิดและการอ้างอิง
ATR อ้างอิงผลงานของ J. Welles Wilder
โค้ดชุดนี้เขียนขึ้นใหม่ โดยใช้ ATR เป็นหน่วยเทียบระยะถอย แล้วติดตามระดับราคาปิดอ้างอิง ราคาปิดที่ถอยมากที่สุด เปอร์เซ็นต์ฟื้นคืน และจำนวนแท่งที่ผ่านไป
ไม่ได้อ้างว่าแนวคิด Drawdown สัดส่วนฟื้นคืน หรือระยะเวลาฟื้นตัวเป็นสิ่งใหม่ทั้งหมด
⏺️ Limitations and disclaimer
🔹 Event direction comes from a qualifying closing-price extreme; it does not prove an underlying trend.
🔹 A recovered reference does not guarantee further continuation.
🔹 Timeout means recovery was not completed within the selected window—not that recovery can never occur.
🔹 Reference and recovery measurements use closes; ATR uses high, low, and previous close.
🔹 Observation-bar counts represent chart bars, not calendar time.
🔹 Synthetic formula checks have been completed. TradingView compilation and real-market validation remain pending for this version.
🔹 For educational and informational purposes only. It does not constitute investment advice or a standalone trading system.
⏺️ ข้อจำกัดและคำชี้แจง
🔹 ทิศทางเหตุการณ์มาจากจุดสุดขั้วของราคาปิดที่เข้าเกณฑ์ ไม่ได้ยืนยันแนวโน้มหลัก
🔹 การกลับถึงระดับเดิมไม่ได้รับประกันว่าจะเคลื่อนไหวต่อในทิศทางนั้น
🔹 Timeout หมายถึงยังกลับไม่ถึงภายในช่วงที่กำหนด ไม่ได้หมายความว่าจะไม่มีวันกลับถึง
🔹 ระดับอ้างอิงและการฟื้นคืนใช้ราคาปิด ส่วน ATR ใช้ High, Low และราคาปิดก่อนหน้า
🔹 จำนวนแท่งเป็นเวลาตามกราฟ ไม่ใช่ระยะเวลาปฏิทิน
🔹 เวอร์ชันนี้ตรวจสูตรด้วยข้อมูลสังเคราะห์แล้ว แต่ยังรอการ Compile ใน TradingView และตรวจสอบกับข้อมูลตลาดจริง
🔹 ใช้เพื่อการศึกษาและประกอบการวิเคราะห์ ไม่ถือเป็นคำแนะนำการลงทุนหรือระบบซื้อขายที่ใช้ได้โดยลำพัง
[DAOL] Recovery Clock tracks individual price-retreat events and measures how much of the retreat has been recovered over time.
For an upward event, it observes a pullback from a recent closing-price high and tracks recovery toward that high.
For a downward event, it observes a rebound from a recent closing-price low and tracks the return toward that low.
🔹 Depth — the largest closing-price retreat, expressed in ATR units
🔹 Recovery — the percentage of that retreat restored by the latest close
🔹 Observed Bars — the number of closed bars since the event started
⏺️ Indicator นี้คืออะไร?
[DAOL] Recovery Clock คือเครื่องมือติดตามการถอยของราคาเป็นรายเหตุการณ์ โดยดูทั้ง ระยะที่ฟื้นคืนและเวลาที่ผ่านไป
ฝั่งขึ้นจะติดตามการย่อจากยอดราคาปิด แล้ววัดการฟื้นกลับไปหายอดเดิม
ฝั่งลงจะติดตามการเด้งจากจุดต่ำของราคาปิด แล้ววัดการกลับลงไปหาจุดต่ำเดิม
🔹 Depth — ระยะถอยมากที่สุดจากราคาปิด แสดงเป็นจำนวน ATR
🔹 Recovery — เปอร์เซ็นต์ของระยะถอยที่ราคาปิดล่าสุดคืนกลับมา
🔹 Observed Bars — จำนวนแท่งปิดตั้งแต่เริ่มเหตุการณ์
⏺️ Why use Recovery Clock?
🔹 Separates retreat depth from recovery duration
🔹 Shows whether price has restored part or all of a retreat
🔹 Uses a fixed reference level throughout each event
🔹 Provides context for pullback and rebound analysis
Two events can have the same retreat depth but different recovery paths and durations. Recovery Clock displays these measurements separately rather than combining them into a single score.
⏺️ ทำไมต้องใช้?
🔹 แยกให้เห็นว่าถอยลึกแค่ไหน และผ่านไปนานเท่าไร
🔹 แสดงว่าราคาคืนระยะกลับมาแล้วบางส่วนหรือทั้งหมด
🔹 ใช้ระดับอ้างอิงเดิมตลอดแต่ละเหตุการณ์
🔹 ใช้ประกอบการวิเคราะห์การย่อและการเด้งของราคา
เหตุการณ์สองครั้งอาจถอยลึกเท่ากัน แต่ฟื้นคืนในจังหวะและเวลาที่ต่างกัน ตัวนี้จึงแสดงแต่ละองค์ประกอบแยกกัน เพื่อให้ตีความได้ตรงไปตรงมา
⏺️ Who should use it?
🔹 Traders monitoring pullbacks and rebounds
🔹 Day traders and swing traders observing recovery toward previous closing-price extremes
🔹 Technical analysts comparing retreat depth with elapsed time
🔹 Users seeking price-based event tracking without a volume requirement
⏺️ เหมาะกับใคร?
🔹 Trader ที่ติดตามการย่อหรือการเด้งของราคา
🔹 Day trader และ Swing trader ที่ดูการกลับไปหาระดับราคาปิดเดิม
🔹 นักวิเคราะห์ที่ต้องการอ่านระยะถอยร่วมกับเวลาที่ผ่านไป
🔹 ผู้ใช้ที่ต้องการติดตามเหตุการณ์จากราคา โดยไม่ต้องใช้ Volume
⏺️ How does it work?
Arm a reference when the close exceeds the highest close, or falls below the lowest close, of the preceding 20 bars.
Before an event starts, a newer qualifying extreme replaces the armed reference.
Start an event when the closing-price retreat reaches at least 1 current ATR.
Freeze the reference price and ATR at event start.
Track the worst adverse close, recovery percentage, and elapsed bars.
End the event when the close reaches the reference price or the observation reaches 20 bars.
Only one reference is armed and one event is tracked at a time. In “Both” mode, a newer opposite extreme can replace the reference before an event starts.
An armed reference expires if no event starts within 20 bars after it was recorded.
⏺️ ทำงานอย่างไร?
เตรียมระดับอ้างอิงเมื่อราคาปิดสูงกว่าราคาปิดสูงสุด หรือต่ำกว่าราคาปิดต่ำสุดของ 20 แท่งก่อนหน้า
ก่อนเริ่มเหตุการณ์ หากเกิดจุดสุดขั้วใหม่ที่เข้าเกณฑ์ จะเปลี่ยนระดับอ้างอิงตาม
เริ่มติดตามเมื่อราคาปิดถอยจากระดับอ้างอิงอย่างน้อย 1 ATR ณ แท่งนั้น
ล็อกราคาอ้างอิงและค่า ATR เมื่อเริ่มเหตุการณ์
ติดตามราคาปิดที่ถอยมากที่สุด เปอร์เซ็นต์ฟื้นคืน และจำนวนแท่งที่ผ่านไป
จบเมื่อราคาปิดกลับถึงระดับอ้างอิง หรือครบ 20 แท่งติดตาม
ระบบเตรียมระดับอ้างอิงและติดตามเหตุการณ์ทีละหนึ่งชุด ในโหมด “Both” จุดสุดขั้วใหม่ฝั่งตรงข้ามสามารถแทนระดับอ้างอิงเดิมได้ก่อนเริ่มเหตุการณ์
หากยังไม่เกิดเหตุการณ์ภายใน 20 แท่งหลังบันทึกระดับอ้างอิง ระดับนั้นจะหมดอายุ
⏺️ Understanding the measurements
Depth (ATR) = Largest Closing-Price Retreat ÷ ATR Frozen at Event Start
Recovery (%) = Restored Distance from the Worst Event Close ÷ Largest Closing-Price Retreat × 100
Example:
🔹 Reference high = 100
🔹 Worst event close = 96
🔹 Latest close = 99
🔹 Recovery = (99 − 96) ÷ (100 − 96) × 100 = 75%
For a downward event, the calculation is reversed to measure the return from the rebound high toward the reference low.
Recovery is capped between 0% and 100%. If a new adverse closing extreme occurs, recovery can fall back to zero.
⏺️ ตัวเลขหมายถึงอะไร?
Depth (ATR) = ระยะถอยมากที่สุดจากราคาปิด ÷ ค่า ATR ที่ล็อกไว้ตอนเริ่มเหตุการณ์
Recovery (%) = ระยะที่คืนกลับมาจากราคาปิดที่ถอยมากที่สุด ÷ ระยะถอยทั้งหมด × 100
ตัวอย่าง:
🔹 ยอดอ้างอิง = 100
🔹 ราคาปิดต่ำสุดระหว่างเหตุการณ์ = 96
🔹 ราคาปิดล่าสุด = 99
🔹 Recovery = (99 − 96) ÷ (100 − 96) × 100 = 75%
ฝั่งลงจะกลับด้านสูตร โดยวัดการกลับจากยอดเด้งไปหาจุดต่ำอ้างอิงเดิม
Recovery อยู่ระหว่าง 0% ถึง 100% หากเกิดราคาปิดที่ถอยมากที่สุดครั้งใหม่ ค่า Recovery สามารถกลับเป็นศูนย์ได้
Recovery 75% หมายถึงคืนระยะมาแล้ว 75% ไม่ใช่โอกาสกลับถึงระดับเดิม 75%
⏺️ How to read the colors
🔵 Blue — an event is active, with recovery below the partial-recovery threshold
🟡 Gold — an event is active, with recovery at or above the partial-recovery threshold
🟢 Green — an upward pullback event closes back at or above its reference high
🔴 Red — a downward rebound event closes back at or below its reference low
⚪ Gray — waiting for an event, or the observation has timed out
The default partial-recovery threshold is 50%.
Red indicates a completed return to the lower reference. It is not an automatic sell signal.
⏺️ อ่านสีอย่างไร?
🔵 ฟ้า — กำลังติดตาม และฟื้นคืนยังไม่ถึงเกณฑ์ Partial Recovery
🟡 ทอง — กำลังติดตาม และฟื้นคืนถึงเกณฑ์ Partial Recovery แล้ว
🟢 เขียว — เหตุการณ์ย่อฝั่งขึ้นกลับมาปิดถึงหรือเหนือยอดอ้างอิง
🔴 แดง — เหตุการณ์เด้งฝั่งลงกลับมาปิดถึงหรือต่ำกว่าจุดต่ำอ้างอิง
⚪ เทา — รอเหตุการณ์ หรือหมดเวลาติดตาม
ค่าเริ่มต้นของ Partial Recovery คือ 50%
สีแดงหมายถึงกลับถึงระดับอ้างอิงฝั่งล่างแล้ว ไม่ใช่คำสั่งขายโดยอัตโนมัติ
⏺️ How to use
🔹 Frozen Recovery Anchor — the reference price the event is trying to recover
🔹 Worst Event Close — the largest adverse closing-price excursion during the event
🔹 Shaded Area — the distance between those two levels
🔹 Track Marker — the start of an observation
🔹 Recovered Marker — the close reaches the reference
🔹 Timeout Marker — the observation expires before recovery
The dashboard displays event direction, worst retreat in ATR units, recovery percentage, observed bars, and event status.
The start bar counts as observation bar 1. The clock measures time since the retreat trigger—not time since the original high or low.
Completed results remain visible until another event starts.
⏺️ วิธีใช้งาน
🔹 Frozen Recovery Anchor — ระดับราคาอ้างอิงที่ใช้เป็นเป้าหมายการคืนระยะ
🔹 Worst Event Close — ราคาปิดที่ถอยมากที่สุดระหว่างเหตุการณ์
🔹 พื้นที่แรเงา — ระยะระหว่างระดับอ้างอิงกับราคาปิดที่ถอยมากที่สุด
🔹 Track — จุดเริ่มติดตาม
🔹 Recovered — ราคาปิดกลับถึงระดับอ้างอิง
🔹 Timeout — หมดเวลาก่อนกลับถึงระดับอ้างอิง
Dashboard แสดงทิศทาง ระยะถอยเป็น ATR เปอร์เซ็นต์ฟื้นคืน จำนวนแท่งที่ติดตาม และสถานะ
แท่งเริ่มเหตุการณ์นับเป็นแท่งที่ 1 โดยนาฬิกานับจากจุดที่ถอยถึงเกณฑ์ ไม่ได้นับจากแท่งที่เกิดยอดหรือจุดต่ำเดิม
ผลที่จบแล้วจะค้างไว้จนเริ่มเหตุการณ์ใหม่
⏺️ Default settings
🔹 Closing Extreme Lookback — 20 bars
🔹 ATR Length — 14
🔹 Retreat Trigger — 1.0 ATR
🔹 Maximum Observation — 20 bars, including the start bar
🔹 Partial Recovery — 50%
🔹 Track Direction — Both
Available direction modes:
🔹 Both
🔹 Up pullbacks
🔹 Down rebounds
A higher retreat trigger requires a larger move before observation starts. A longer observation window allows more time to recover the reference.
⏺️ ค่าเริ่มต้น
🔹 Closing Extreme Lookback — 20 แท่ง
🔹 ATR Length — 14
🔹 Retreat Trigger — 1.0 ATR
🔹 Maximum Observation — 20 แท่ง รวมแท่งเริ่มเหตุการณ์
🔹 Partial Recovery — 50%
🔹 Track Direction — Both
เลือกติดตามได้ 3 แบบ:
🔹 Both — ทั้งสองฝั่ง
🔹 Up pullbacks — การย่อจากยอด
🔹 Down rebounds — การเด้งจากจุดต่ำ
การเพิ่ม Retreat Trigger ทำให้ต้องถอยมากขึ้นก่อนเริ่มติดตาม ส่วนการเพิ่มช่วงติดตามทำให้มีเวลารอการกลับถึงระดับอ้างอิงมากขึ้น
⏺️ Alerts
🔹 Recovery observation started
🔹 First partial recovery
🔹 Up anchor recovered
🔹 Down anchor recovered
🔹 Recovery timed out
🔹 Any completed event
The partial-recovery alert fires at most once per event. It does not repeat if recovery falls and later crosses the threshold again.
If the reference is recovered on the final allowed bar, recovery takes priority over timeout.
To receive alerts, create an alert in TradingView, select the desired condition, and choose “Once Per Bar Close.”
⏺️ การแจ้งเตือน
🔹 Recovery observation started — เริ่มติดตามเมื่อถอยถึงเกณฑ์
🔹 First partial recovery — ผ่านเกณฑ์ฟื้นคืนบางส่วนครั้งแรก
🔹 Up anchor recovered — กลับถึงยอดอ้างอิง
🔹 Down anchor recovered — กลับถึงจุดต่ำอ้างอิง
🔹 Recovery timed out — หมดเวลาติดตาม
🔹 Any completed event — แจ้งเมื่อจบเหตุการณ์
Alert ฟื้นคืนบางส่วนแจ้งได้สูงสุดหนึ่งครั้งต่อเหตุการณ์ ไม่แจ้งซ้ำเมื่อค่าลดลงแล้วกลับมาผ่านเกณฑ์อีก
หากกลับถึงระดับอ้างอิงในแท่งสุดท้ายที่อนุญาต ระบบจะจัดเป็น Recovered ก่อนพิจารณา Timeout
หากต้องการรับ Alert ให้สร้างการแจ้งเตือนใน TradingView เลือกเงื่อนไขที่ต้องการ และตั้ง “Once Per Bar Close”
⏺️ Key Features
🔹 Event-based pullback and rebound tracking
🔹 Frozen reference price and ATR
🔹 Retreat depth expressed in ATR units
🔹 Recovery percentage and observation duration
🔹 Closed-bar markers and alerts
🔹 No future-bar references, hindsight pivots, or multi-timeframe requests
⏺️ จุดเด่น
🔹 ติดตามการย่อและการเด้งเป็นรายเหตุการณ์
🔹 ล็อกราคาอ้างอิงและ ATR เมื่อเริ่มติดตาม
🔹 แสดงระยะถอยด้วยหน่วย ATR
🔹 แสดงเปอร์เซ็นต์ฟื้นคืนและจำนวนแท่งที่ผ่านไป
🔹 มีสัญลักษณ์และ Alert จากแท่งปิด
🔹 ไม่ใช้แท่งอนาคต Pivot ที่รอข้อมูลย้อนหลัง หรือข้อมูลจาก Timeframe อื่น
⏺️ Concept and attribution
ATR is based on the work of J. Welles Wilder.
This independently written implementation uses ATR to normalize retreat depth, then tracks a fixed closing-price reference, the worst adverse close, recovery percentage, and elapsed bars.
It does not claim that drawdown, recovery ratios, or recovery duration are entirely new concepts.
Reference:
TradingView — Average True Range (ATR)
tradingview.com/support/solutions/43000501823-average-true-range-atr/
⏺️ แนวคิดและการอ้างอิง
ATR อ้างอิงผลงานของ J. Welles Wilder
โค้ดชุดนี้เขียนขึ้นใหม่ โดยใช้ ATR เป็นหน่วยเทียบระยะถอย แล้วติดตามระดับราคาปิดอ้างอิง ราคาปิดที่ถอยมากที่สุด เปอร์เซ็นต์ฟื้นคืน และจำนวนแท่งที่ผ่านไป
ไม่ได้อ้างว่าแนวคิด Drawdown สัดส่วนฟื้นคืน หรือระยะเวลาฟื้นตัวเป็นสิ่งใหม่ทั้งหมด
⏺️ Limitations and disclaimer
🔹 Event direction comes from a qualifying closing-price extreme; it does not prove an underlying trend.
🔹 A recovered reference does not guarantee further continuation.
🔹 Timeout means recovery was not completed within the selected window—not that recovery can never occur.
🔹 Reference and recovery measurements use closes; ATR uses high, low, and previous close.
🔹 Observation-bar counts represent chart bars, not calendar time.
🔹 Synthetic formula checks have been completed. TradingView compilation and real-market validation remain pending for this version.
🔹 For educational and informational purposes only. It does not constitute investment advice or a standalone trading system.
⏺️ ข้อจำกัดและคำชี้แจง
🔹 ทิศทางเหตุการณ์มาจากจุดสุดขั้วของราคาปิดที่เข้าเกณฑ์ ไม่ได้ยืนยันแนวโน้มหลัก
🔹 การกลับถึงระดับเดิมไม่ได้รับประกันว่าจะเคลื่อนไหวต่อในทิศทางนั้น
🔹 Timeout หมายถึงยังกลับไม่ถึงภายในช่วงที่กำหนด ไม่ได้หมายความว่าจะไม่มีวันกลับถึง
🔹 ระดับอ้างอิงและการฟื้นคืนใช้ราคาปิด ส่วน ATR ใช้ High, Low และราคาปิดก่อนหน้า
🔹 จำนวนแท่งเป็นเวลาตามกราฟ ไม่ใช่ระยะเวลาปฏิทิน
🔹 เวอร์ชันนี้ตรวจสูตรด้วยข้อมูลสังเคราะห์แล้ว แต่ยังรอการ Compile ใน TradingView และตรวจสอบกับข้อมูลตลาดจริง
🔹 ใช้เพื่อการศึกษาและประกอบการวิเคราะห์ ไม่ถือเป็นคำแนะนำการลงทุนหรือระบบซื้อขายที่ใช้ได้โดยลำพัง

Aviso legal
As informações e publicações não se destinam a ser, e não constituem, conselhos ou recomendações financeiras, de investimento, comerciais ou de outro tipo fornecidos ou endossados pela TradingView. Leia mais nos Termos de Uso.
Aviso legal
As informações e publicações não se destinam a ser, e não constituem, conselhos ou recomendações financeiras, de investimento, comerciais ou de outro tipo fornecidos ou endossados pela TradingView. Leia mais nos Termos de Uso.