Nebbia Ranges
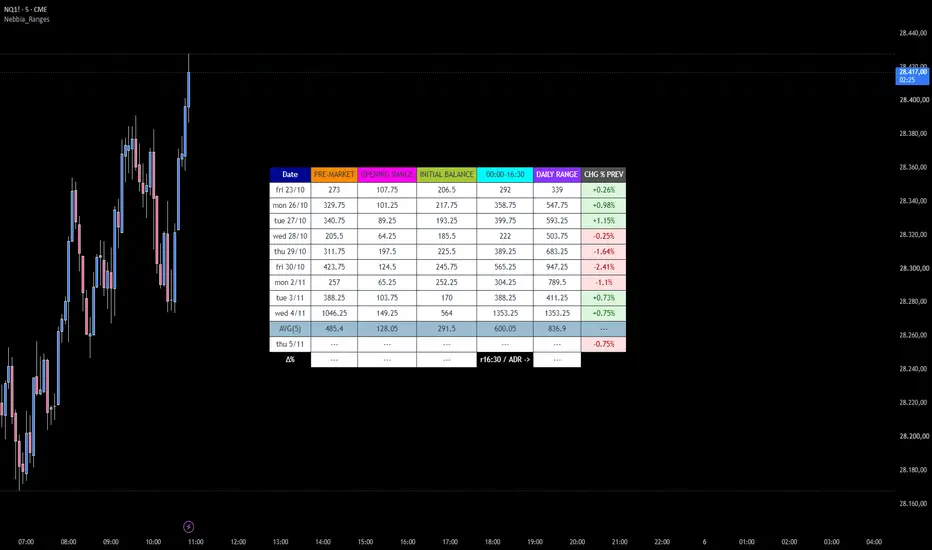
# Nebbia Ranges – Intraday Session & Historical Range Analysis
## Overview
**Nebbia Ranges** is an advanced intraday market analysis indicator designed to help traders evaluate price range expansion, volatility conditions, and historical session behavior.
Developed specifically for the **5-minute timeframe**, the indicator provides a comprehensive statistical dashboard that compares current market activity with historical price ranges across multiple trading sessions.
By combining historical range analysis, weekday-specific statistics, real-time monitoring, and a proprietary scoring system, Nebbia Ranges helps traders better understand the current market environment and identify potential volatility expansion or contraction conditions.
The indicator is particularly suited for traders analyzing US index futures, including the E-mini S&P 500 (ES) and E-mini Nasdaq-100 (NQ).
## Key Features
### 1. Multiple Intraday Session Ranges
The indicator automatically calculates and tracks five important trading session ranges:
- **Pre-Market (PM):** From 6:00 PM of the previous calendar day to 9:30 AM New York time.
- **Opening Range (OR):** From 9:30 AM to 9:35 AM New York time.
- **Initial Balance (IB):** From 9:30 AM to 10:30 AM New York time.
- **Extended Session Range:** From 6:00 PM of the previous day to 10:30 AM New York time.
- **Daily Range (DR):** From 6:00 PM of the previous day to 4:55 PM New York time.
Each range is calculated as the difference between the highest and lowest prices recorded during its respective session.
All session calculations are based on the **America/New_York timezone**, allowing automatic adjustment for US daylight saving time changes.
### 2. Two Historical Analysis Modes
**PastDays Mode**
This mode displays the most recent trading sessions and calculates historical averages over a configurable number of completed trading days.
Traders can:
- Review recent session range values.
- Compare current ranges with historical averages.
- Identify sessions exhibiting unusually high or low volatility.
- Monitor the current trading day as it develops.
- Evaluate percentage deviations from average session behavior.
The historical average period can be configured from 2 to 9 trading days.
**SpecDays Mode**
This mode introduces weekday-specific historical analysis.
Instead of comparing the current session with consecutive trading days, traders can analyze historical observations from the same day of the week.
For example, a trader analyzing Tuesday's market behavior can compare its session ranges with previous Tuesdays rather than with all recent trading days.
Features include:
- Selection of Monday, Tuesday, Wednesday, Thursday, or Friday.
- Automatic weekday selection based on the current trading day.
- Configurable historical comparison from 2 to 9 weekday observations.
- Adjustable history depth.
- Weekday-specific average range calculations.
This functionality helps traders investigate recurring weekday volatility patterns and compare current market conditions with more targeted historical references.
### 3. Historical Average and Percentage Deviation Analysis
Nebbia Ranges calculates average range values for the monitored trading sessions.
The **Δ% (Delta Percentage)** row measures how much a session's range differs from its corresponding historical average.
The calculation is:
**Δ% = [(Current Range − Historical Average) / Historical Average] × 100**
Color-coded cells provide immediate visual feedback:
- **Red:** The current range exceeds its historical average by at least the configured threshold.
- **Green:** The current range is below its historical average by at least the configured threshold.
- **Yellow:** The deviation remains within the configured thresholds.
The default deviation threshold is 15%, and it can be customized.
This comparison allows traders to quickly recognize whether a session is experiencing relatively expanded, compressed, or typical price movement.
### 4. Daily Range and Daily Change Analysis
The indicator also monitors the Daily Range and the percentage change in price.
**Daily Range (DR)**
The Daily Range represents the difference between the highest and lowest prices reached during the defined trading day.
It can be displayed either as:
- Absolute price range.
- Percentage range relative to the session low.
**Daily Change Percentage (CHG%)**
The Daily Change can be calculated using two different reference points:
- **Previous Close:** Percentage change from the previous trading day's session close.
- **Daily Open:** Percentage change from the current trading day's opening price.
Positive and negative daily changes are displayed with different background colors for improved readability.
These measurements help distinguish overall price movement from the total intraday range.
### 5. Intraday Scoring System
Nebbia Ranges includes a proprietary numerical scoring system that combines several market observations:
- Historical Daily Range behavior.
- Current time of day.
- Pre-Market range relative to its historical average.
- Opening Range relative to its historical average.
The resulting score is displayed alongside the current trading date during the supported intraday window.
The score is highlighted using three colors:
- **Green:** Score of 130 or below.
- **Yellow:** Score between 131 and 169.
- **Red:** Score of 170 or above.
The scoring system is intended as a contextual market assessment tool, offering a consolidated view of the conditions measured by the indicator.
It should not be interpreted as a guaranteed directional forecast, a statistically validated probability, or an automatic buy/sell signal.
### 6. Extended Session Range vs. Average Daily Range
An additional metric compares the extended session range ending at 10:30 AM New York time with the historical Average Daily Range (ADR).
The calculation is:
**Range / ADR (%) = (Extended Session Range / Average Daily Range) × 100**
This measurement helps traders assess how much of the historically observed daily price range has already developed by 10:30 AM.
The result is displayed using a configurable color threshold, set to 80% by default.
- **Green:** The ratio is at or below the configured threshold.
- **Red:** The ratio exceeds the configured threshold.
This feature provides an additional perspective on early-session volatility and range development.
### 7. Optional Real-Time Monitoring
The indicator supports real-time range monitoring for all five tracked sessions.
Each real-time display can be enabled or disabled independently:
- Real-Time Pre-Market
- Real-Time Opening Range
- Real-Time Initial Balance
- Real-Time Extended Session Range
- Real-Time Daily Range
When enabled, the corresponding range updates as new price data becomes available.
This allows traders to monitor session development without waiting for the session to be completed.
### 8. Daily Range Alert
Nebbia Ranges includes an optional alert designed to identify when the developing Daily Range reaches or exceeds its selected historical average.
The alert uses the average associated with the active analysis mode:
- PastDays historical average.
- SpecDays weekday-specific historical average, when the selected weekday matches the current trading day.
This feature can assist traders in monitoring significant range development during the trading session.
Real-Time Daily Range monitoring and the Daily Range alert option must both be enabled for the condition to activate.
## How to Use
**Step 1 – Select the correct timeframe**
Apply the indicator to a 5-minute chart. Other timeframes are not supported.
**Step 2 – Choose the analysis mode**
Use PastDays for comparisons with recent trading sessions, or SpecDays for weekday-specific historical analysis.
**Step 3 – Configure historical averages**
Adjust the number of historical periods according to the desired reference window.
Shorter periods respond more quickly to recent changes, while longer periods provide a broader historical comparison.
**Step 4 – Monitor session ranges**
Observe the Pre-Market, Opening Range, Initial Balance, Extended Session Range, and Daily Range values.
Compare these measurements with their respective historical averages.
**Step 5 – Evaluate percentage deviations**
Use the Δ% row to determine whether current session ranges are larger or smaller than their historical references.
Pay particular attention to unusually large deviations, which may indicate changes in intraday volatility conditions.
**Step 6 – Interpret the score and range-to-ADR ratio**
Use these additional metrics as contextual information alongside price action, market structure, and your existing trading methodology.
**Step 7 – Enable real-time monitoring and alerts**
Activate the desired real-time displays and configure the Daily Range alert when necessary.
## Important Notes
- **Timeframe:** The indicator is designed exclusively for 5-minute charts.
- **Market sessions:** All trading session boundaries are based on New York time.
- **Historical data:** Calculations depend on the amount and quality of historical intraday data available on the chart.
- **Incomplete sessions:** Current session values may change until their respective sessions have ended.
- **Historical averages:** Only available qualifying observations are included in average calculations.
- **Market compatibility:** The indicator is designed primarily around US index futures trading hours. Results on other markets may not represent their native trading sessions.
- **Signal interpretation:** The indicator is an analytical dashboard and does not generate standalone entry or exit signals.
## Disclaimer
Nebbia Ranges is intended for educational, statistical, and market analysis purposes only.
Historical volatility patterns and range behavior do not guarantee future market performance.
The indicator's scoring system, historical averages, and color-coded measurements should be interpreted as supporting information rather than investment advice or predictive trading signals.
Always use appropriate risk management and independent analysis when making trading decisions.
---
**Developed by Stefano Masiero – Nebbia Trading**
## Overview
**Nebbia Ranges** is an advanced intraday market analysis indicator designed to help traders evaluate price range expansion, volatility conditions, and historical session behavior.
Developed specifically for the **5-minute timeframe**, the indicator provides a comprehensive statistical dashboard that compares current market activity with historical price ranges across multiple trading sessions.
By combining historical range analysis, weekday-specific statistics, real-time monitoring, and a proprietary scoring system, Nebbia Ranges helps traders better understand the current market environment and identify potential volatility expansion or contraction conditions.
The indicator is particularly suited for traders analyzing US index futures, including the E-mini S&P 500 (ES) and E-mini Nasdaq-100 (NQ).
## Key Features
### 1. Multiple Intraday Session Ranges
The indicator automatically calculates and tracks five important trading session ranges:
- **Pre-Market (PM):** From 6:00 PM of the previous calendar day to 9:30 AM New York time.
- **Opening Range (OR):** From 9:30 AM to 9:35 AM New York time.
- **Initial Balance (IB):** From 9:30 AM to 10:30 AM New York time.
- **Extended Session Range:** From 6:00 PM of the previous day to 10:30 AM New York time.
- **Daily Range (DR):** From 6:00 PM of the previous day to 4:55 PM New York time.
Each range is calculated as the difference between the highest and lowest prices recorded during its respective session.
All session calculations are based on the **America/New_York timezone**, allowing automatic adjustment for US daylight saving time changes.
### 2. Two Historical Analysis Modes
**PastDays Mode**
This mode displays the most recent trading sessions and calculates historical averages over a configurable number of completed trading days.
Traders can:
- Review recent session range values.
- Compare current ranges with historical averages.
- Identify sessions exhibiting unusually high or low volatility.
- Monitor the current trading day as it develops.
- Evaluate percentage deviations from average session behavior.
The historical average period can be configured from 2 to 9 trading days.
**SpecDays Mode**
This mode introduces weekday-specific historical analysis.
Instead of comparing the current session with consecutive trading days, traders can analyze historical observations from the same day of the week.
For example, a trader analyzing Tuesday's market behavior can compare its session ranges with previous Tuesdays rather than with all recent trading days.
Features include:
- Selection of Monday, Tuesday, Wednesday, Thursday, or Friday.
- Automatic weekday selection based on the current trading day.
- Configurable historical comparison from 2 to 9 weekday observations.
- Adjustable history depth.
- Weekday-specific average range calculations.
This functionality helps traders investigate recurring weekday volatility patterns and compare current market conditions with more targeted historical references.
### 3. Historical Average and Percentage Deviation Analysis
Nebbia Ranges calculates average range values for the monitored trading sessions.
The **Δ% (Delta Percentage)** row measures how much a session's range differs from its corresponding historical average.
The calculation is:
**Δ% = [(Current Range − Historical Average) / Historical Average] × 100**
Color-coded cells provide immediate visual feedback:
- **Red:** The current range exceeds its historical average by at least the configured threshold.
- **Green:** The current range is below its historical average by at least the configured threshold.
- **Yellow:** The deviation remains within the configured thresholds.
The default deviation threshold is 15%, and it can be customized.
This comparison allows traders to quickly recognize whether a session is experiencing relatively expanded, compressed, or typical price movement.
### 4. Daily Range and Daily Change Analysis
The indicator also monitors the Daily Range and the percentage change in price.
**Daily Range (DR)**
The Daily Range represents the difference between the highest and lowest prices reached during the defined trading day.
It can be displayed either as:
- Absolute price range.
- Percentage range relative to the session low.
**Daily Change Percentage (CHG%)**
The Daily Change can be calculated using two different reference points:
- **Previous Close:** Percentage change from the previous trading day's session close.
- **Daily Open:** Percentage change from the current trading day's opening price.
Positive and negative daily changes are displayed with different background colors for improved readability.
These measurements help distinguish overall price movement from the total intraday range.
### 5. Intraday Scoring System
Nebbia Ranges includes a proprietary numerical scoring system that combines several market observations:
- Historical Daily Range behavior.
- Current time of day.
- Pre-Market range relative to its historical average.
- Opening Range relative to its historical average.
The resulting score is displayed alongside the current trading date during the supported intraday window.
The score is highlighted using three colors:
- **Green:** Score of 130 or below.
- **Yellow:** Score between 131 and 169.
- **Red:** Score of 170 or above.
The scoring system is intended as a contextual market assessment tool, offering a consolidated view of the conditions measured by the indicator.
It should not be interpreted as a guaranteed directional forecast, a statistically validated probability, or an automatic buy/sell signal.
### 6. Extended Session Range vs. Average Daily Range
An additional metric compares the extended session range ending at 10:30 AM New York time with the historical Average Daily Range (ADR).
The calculation is:
**Range / ADR (%) = (Extended Session Range / Average Daily Range) × 100**
This measurement helps traders assess how much of the historically observed daily price range has already developed by 10:30 AM.
The result is displayed using a configurable color threshold, set to 80% by default.
- **Green:** The ratio is at or below the configured threshold.
- **Red:** The ratio exceeds the configured threshold.
This feature provides an additional perspective on early-session volatility and range development.
### 7. Optional Real-Time Monitoring
The indicator supports real-time range monitoring for all five tracked sessions.
Each real-time display can be enabled or disabled independently:
- Real-Time Pre-Market
- Real-Time Opening Range
- Real-Time Initial Balance
- Real-Time Extended Session Range
- Real-Time Daily Range
When enabled, the corresponding range updates as new price data becomes available.
This allows traders to monitor session development without waiting for the session to be completed.
### 8. Daily Range Alert
Nebbia Ranges includes an optional alert designed to identify when the developing Daily Range reaches or exceeds its selected historical average.
The alert uses the average associated with the active analysis mode:
- PastDays historical average.
- SpecDays weekday-specific historical average, when the selected weekday matches the current trading day.
This feature can assist traders in monitoring significant range development during the trading session.
Real-Time Daily Range monitoring and the Daily Range alert option must both be enabled for the condition to activate.
## How to Use
**Step 1 – Select the correct timeframe**
Apply the indicator to a 5-minute chart. Other timeframes are not supported.
**Step 2 – Choose the analysis mode**
Use PastDays for comparisons with recent trading sessions, or SpecDays for weekday-specific historical analysis.
**Step 3 – Configure historical averages**
Adjust the number of historical periods according to the desired reference window.
Shorter periods respond more quickly to recent changes, while longer periods provide a broader historical comparison.
**Step 4 – Monitor session ranges**
Observe the Pre-Market, Opening Range, Initial Balance, Extended Session Range, and Daily Range values.
Compare these measurements with their respective historical averages.
**Step 5 – Evaluate percentage deviations**
Use the Δ% row to determine whether current session ranges are larger or smaller than their historical references.
Pay particular attention to unusually large deviations, which may indicate changes in intraday volatility conditions.
**Step 6 – Interpret the score and range-to-ADR ratio**
Use these additional metrics as contextual information alongside price action, market structure, and your existing trading methodology.
**Step 7 – Enable real-time monitoring and alerts**
Activate the desired real-time displays and configure the Daily Range alert when necessary.
## Important Notes
- **Timeframe:** The indicator is designed exclusively for 5-minute charts.
- **Market sessions:** All trading session boundaries are based on New York time.
- **Historical data:** Calculations depend on the amount and quality of historical intraday data available on the chart.
- **Incomplete sessions:** Current session values may change until their respective sessions have ended.
- **Historical averages:** Only available qualifying observations are included in average calculations.
- **Market compatibility:** The indicator is designed primarily around US index futures trading hours. Results on other markets may not represent their native trading sessions.
- **Signal interpretation:** The indicator is an analytical dashboard and does not generate standalone entry or exit signals.
## Disclaimer
Nebbia Ranges is intended for educational, statistical, and market analysis purposes only.
Historical volatility patterns and range behavior do not guarantee future market performance.
The indicator's scoring system, historical averages, and color-coded measurements should be interpreted as supporting information rather than investment advice or predictive trading signals.
Always use appropriate risk management and independent analysis when making trading decisions.
---
**Developed by Stefano Masiero – Nebbia Trading**

Aviso legal
As informações e publicações não se destinam a ser, e não constituem, conselhos ou recomendações financeiras, de investimento, comerciais ou de outro tipo fornecidos ou endossados pela TradingView. Leia mais nos Termos de Uso.
Aviso legal
As informações e publicações não se destinam a ser, e não constituem, conselhos ou recomendações financeiras, de investimento, comerciais ou de outro tipo fornecidos ou endossados pela TradingView. Leia mais nos Termos de Uso.