Atualizado
Session Intelligence Engine Pro [MQLSoftware]
Get this and other exclusive indicators in MQLSoftware Pro Analysis Suite
This indicator is part of MQLSoftware's Paid Space. Subscribe for $69.00/month to use it on your charts along with the author's other exclusive indicators. You pay right on TradingView and get access straight away.
Explore MQLSoftware Pro Analysis SuiteOVERVIEW
Session Intelligence Engine Pro turns a defined session range into a structured trade plan. Instead of showing isolated breakout marks, it brings the full decision sequence into one overlay: reference levels, trend context, qualification, entry planning, fixed risk levels and trade resolution. The goal is to help answer the questions that matter most around a session boundary: is price actually breaking out, is the move aligned with the current trend, is the setup qualified, and where does the plan become invalid? SIE-Pro is an analysis tool. It does not place orders. Examples below illustrate how the logic works; they are not forecasts or expected performance.
CONCEPTS
Each setup begins with a reference range. Forex and metals can use pre-session ranges, crypto can use UTC-based windows, and stocks or indices can use exchange-session logic. On higher intraday timeframes, the previous regular-session range can also serve as the reference. Custom Sessions lets you define the window and timezone manually. Once the range is complete, its boundaries are fixed.
Trend context comes from an adaptive channel built from an EMA midpoint and ATR-based distance. The midpoint, confirmed direction and prior slope help establish whether a setup is aligned with the current move. Higher-timeframe trend and ADX provide additional context. Range Quality compares the current session structure with recent ranges.
What makes SIE-Pro different is not any single component. It is the sequence: Range → Direction → Qualification → Pending Plan → Entry → Resolution. This makes the setup visible as a process rather than a single arrow appearing after price crosses a level.
Bitcoin: fixed session boundaries with adaptive trend context.

This chart illustrates how fixed session boundaries and the adaptive trend context coexist while qualified plans are displayed.
FEATURES
SIE-Pro supports two entry models. First Touch models an entry when price reaches the fixed session boundary. Retest waits for a confirmed close beyond the boundary and then a later return. This can provide additional confirmation, but naturally it may miss moves that break and continue without coming back.
Once a trade plan is armed, its risk levels are fixed. P/L Ratio controls target distance relative to that risk. Gap-aware logic allows the modeled entry price to differ from the original session edge when necessary.
Index: fixed risk after the plan is armed.

Retained entry, stop and target levels make completed plans easy to review directly on the chart. These are modeled levels for analysis, not executable orders.
SIE-Pro can track up to five qualified plans within one confirmed local trend, with only one plan active at a time. A change in trend state by itself is informational, not a trade signal. If direction changes before a setup becomes qualified, no trade plan is armed, no allocation is consumed, and there is no SL/TP or trade outcome to include in plan statistics. Optional retest markers, three SL/TP modes and HUD controls let you choose how much information stays visible on the chart.
HOW TO USE
A good starting point is Auto Market Session, Auto filters and the default entry and risk settings. Built-in presets cover supported market and timeframe combinations, while other combinations use fallback settings that can be adjusted manually. This makes the indicator usable across different asset classes without requiring every setup to be configured from scratch.
You can refine the setup with Entry Trigger — First Touch or Retest; Range Quality — how selective the session range must be; Trend Strength — minimum trend confirmation; Channel Speed — how quickly the trend channel responds; Stop Distance — modeled price risk; and P/L Ratio — target distance relative to risk.
Apple: reading the decision panels.

The HUD shows the current session state, range qualification, direction and remaining plan allocation. Outcome Statistics summarizes resolved BUY and SELL plans over up to 365 days of available chart data. Positive results include profitable time-based exits. Total R is calculated before fees, spread and slippage.
Signals and alerts are confirmed at chart-bar close. When sufficient lower-timeframe data is available, SIE-Pro uses it to reconstruct the sequence of entry and exit touches inside the bar. When that coverage is unavailable, the script falls back to conservative chart-bar assumptions. If stop and target touches are ambiguous, the stop is assumed first.
Forming ranges and trend values update while the current bar is live. Confirmed signals do not move after bar close. After a plan is resolved, its historical entry label may be displayed at a smaller size for visual organization. The original entry location, direction and outcome remain on the chart; only the label size changes after resolution. Results can vary with symbol, feed, timeframe and available historical data.
CONCLUSION
SIE-Pro is built around a simple workflow: read the range, confirm the direction, check qualification, then evaluate the plan. Instead of asking you to react to every break of a session high or low, the overlay keeps the range, trend context, qualification, risk and outcome connected in one decision framework. That makes each setup easier to understand while it develops and easier to review after it is finished, without treating a selected chart or historical result as a forecast.
Session Intelligence Engine Pro turns a defined session range into a structured trade plan. Instead of showing isolated breakout marks, it brings the full decision sequence into one overlay: reference levels, trend context, qualification, entry planning, fixed risk levels and trade resolution. The goal is to help answer the questions that matter most around a session boundary: is price actually breaking out, is the move aligned with the current trend, is the setup qualified, and where does the plan become invalid? SIE-Pro is an analysis tool. It does not place orders. Examples below illustrate how the logic works; they are not forecasts or expected performance.
CONCEPTS
Each setup begins with a reference range. Forex and metals can use pre-session ranges, crypto can use UTC-based windows, and stocks or indices can use exchange-session logic. On higher intraday timeframes, the previous regular-session range can also serve as the reference. Custom Sessions lets you define the window and timezone manually. Once the range is complete, its boundaries are fixed.
Trend context comes from an adaptive channel built from an EMA midpoint and ATR-based distance. The midpoint, confirmed direction and prior slope help establish whether a setup is aligned with the current move. Higher-timeframe trend and ADX provide additional context. Range Quality compares the current session structure with recent ranges.
What makes SIE-Pro different is not any single component. It is the sequence: Range → Direction → Qualification → Pending Plan → Entry → Resolution. This makes the setup visible as a process rather than a single arrow appearing after price crosses a level.
Bitcoin: fixed session boundaries with adaptive trend context.
This chart illustrates how fixed session boundaries and the adaptive trend context coexist while qualified plans are displayed.
FEATURES
SIE-Pro supports two entry models. First Touch models an entry when price reaches the fixed session boundary. Retest waits for a confirmed close beyond the boundary and then a later return. This can provide additional confirmation, but naturally it may miss moves that break and continue without coming back.
Once a trade plan is armed, its risk levels are fixed. P/L Ratio controls target distance relative to that risk. Gap-aware logic allows the modeled entry price to differ from the original session edge when necessary.
Index: fixed risk after the plan is armed.
Retained entry, stop and target levels make completed plans easy to review directly on the chart. These are modeled levels for analysis, not executable orders.
SIE-Pro can track up to five qualified plans within one confirmed local trend, with only one plan active at a time. A change in trend state by itself is informational, not a trade signal. If direction changes before a setup becomes qualified, no trade plan is armed, no allocation is consumed, and there is no SL/TP or trade outcome to include in plan statistics. Optional retest markers, three SL/TP modes and HUD controls let you choose how much information stays visible on the chart.
HOW TO USE
A good starting point is Auto Market Session, Auto filters and the default entry and risk settings. Built-in presets cover supported market and timeframe combinations, while other combinations use fallback settings that can be adjusted manually. This makes the indicator usable across different asset classes without requiring every setup to be configured from scratch.
You can refine the setup with Entry Trigger — First Touch or Retest; Range Quality — how selective the session range must be; Trend Strength — minimum trend confirmation; Channel Speed — how quickly the trend channel responds; Stop Distance — modeled price risk; and P/L Ratio — target distance relative to risk.
Apple: reading the decision panels.
The HUD shows the current session state, range qualification, direction and remaining plan allocation. Outcome Statistics summarizes resolved BUY and SELL plans over up to 365 days of available chart data. Positive results include profitable time-based exits. Total R is calculated before fees, spread and slippage.
Signals and alerts are confirmed at chart-bar close. When sufficient lower-timeframe data is available, SIE-Pro uses it to reconstruct the sequence of entry and exit touches inside the bar. When that coverage is unavailable, the script falls back to conservative chart-bar assumptions. If stop and target touches are ambiguous, the stop is assumed first.
Forming ranges and trend values update while the current bar is live. Confirmed signals do not move after bar close. After a plan is resolved, its historical entry label may be displayed at a smaller size for visual organization. The original entry location, direction and outcome remain on the chart; only the label size changes after resolution. Results can vary with symbol, feed, timeframe and available historical data.
CONCLUSION
SIE-Pro is built around a simple workflow: read the range, confirm the direction, check qualification, then evaluate the plan. Instead of asking you to react to every break of a session high or low, the overlay keeps the range, trend context, qualification, risk and outcome connected in one decision framework. That makes each setup easier to understand while it develops and easier to review after it is finished, without treating a selected chart or historical result as a forecast.
Notas de Lançamento
Refined the SIE Pro decision framework for clearer handling of continuation, reversal, and no-trade conditions. This update also simplifies the settings, improves confirmation and risk/reward controls, and makes range states and trade types easier to distinguish visually.Notas de Lançamento
v1.5.16 — Decision Map interfaceThe trading engine is unchanged from v1.5.15: sessions, range qualification, continuation and reversal logic, entry, stop and target levels, alerts, default settings and statistics calculations are identical. This update redesigns how each decision is shown.
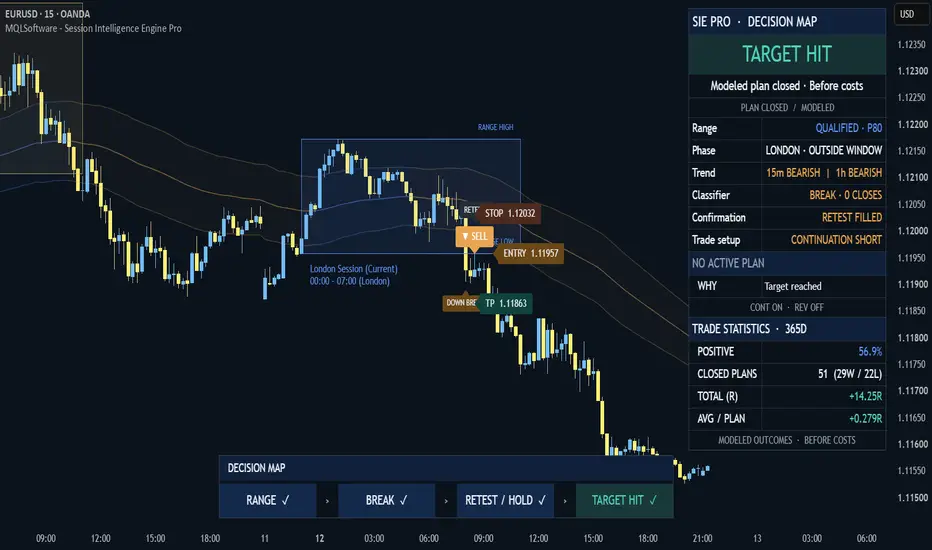
- New status panel — one large status line (BUY ACTIVE, SELL ACTIVE, BUY/SELL LIMIT or STOP ARMED, WAITING FOR BREAK, NO TRADE, TARGET HIT, STOP HIT, PLAN EXPIRED), followed by Range, Phase, Trend, Classifier, Confirmation and Trade setup, the Entry / Stop / Target / R:R plan, a WHY or NEXT line and 365-day modeled statistics before costs.
- Decision Map strip — shows only the stages the engine actually recorded: Range → Break → Accepted → Retest → Trade, Range → First Touch → Trade, Range → Sweep → Reclaim → Trade for reversals, or Range → Break → No Trade.
- Chart events — Break, Accepted, Retest, Reclaim and No Trade markers for the current and previous session. Earlier attempts fade, so the live setup stays readable.
- Trade levels — entry line plus Entry, Stop and Target price tags. Pending levels are dotted and labelled PENDING until filled.
- Session captions under the current and previous reference range.
- Reversal context — a reversal taken against both the chart and higher-timeframe trend is marked COUNTER-TREND AT ENTRY.
- New Display settings — Show Decision Map, Show Decision Events, Show No Trade Markers, Interface Size (Standard / Compact) and Show EMA/ATR Channel. All existing settings keep their previous defaults.
Statistics are modeled outcomes before trading costs on the loaded chart history. They describe past chart behavior and are not a forecast.

🟣 Free tools, guides & product resources:
mqlsoftware.com/account/
🟣 New tools, releases & updates:
t.me/mqlsoftware_official
MQLSoftware — trading analysis tools & indicators.
mqlsoftware.com/account/
🟣 New tools, releases & updates:
t.me/mqlsoftware_official
MQLSoftware — trading analysis tools & indicators.
Aviso legal
As informações e publicações não se destinam a ser, e não constituem, conselhos ou recomendações financeiras, de investimento, comerciais ou de outro tipo fornecidos ou endossados pela TradingView. Leia mais nos Termos de Uso.
🟣 Free tools, guides & product resources:
mqlsoftware.com/account/
🟣 New tools, releases & updates:
t.me/mqlsoftware_official
MQLSoftware — trading analysis tools & indicators.
mqlsoftware.com/account/
🟣 New tools, releases & updates:
t.me/mqlsoftware_official
MQLSoftware — trading analysis tools & indicators.
Aviso legal
As informações e publicações não se destinam a ser, e não constituem, conselhos ou recomendações financeiras, de investimento, comerciais ou de outro tipo fornecidos ou endossados pela TradingView. Leia mais nos Termos de Uso.