Atualizado
[blackcat] L2 Ehlers Market Mode Identifier
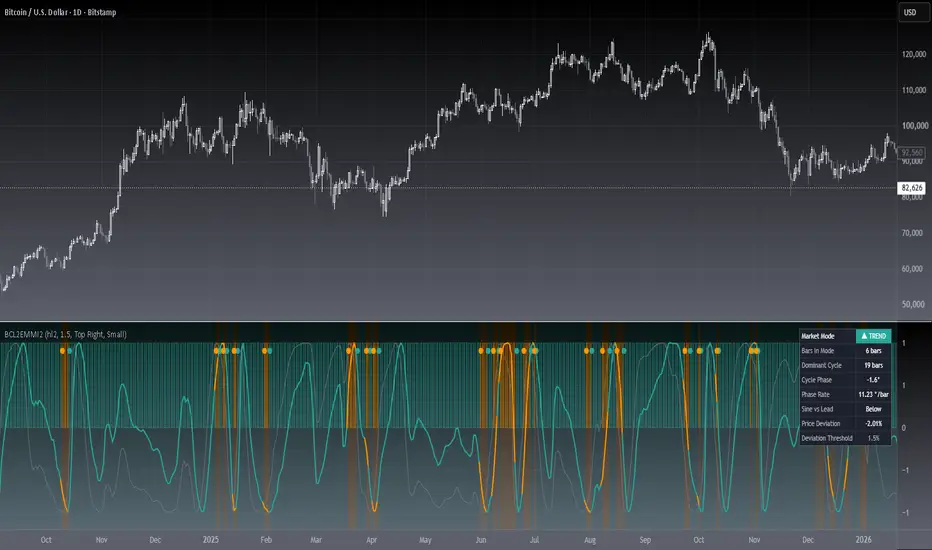
Level: 2
Background
John F. Ehlers introuced Market Mode Identifier in his "Rocket Science for Traders" chapter 11. The simplified model of the market, derived from the Drunkard's Walk problem, has only two modes-the Cycle Mode and the Trend Mode. Through the derivation of the Sinewave Indicator and the Instantaneous Trendline, Ehlers had shown several ways to estimate which mode the market may have for a given moment. As with most technical indicators, the decision point between modes is not clear-cut. In fact, trying to automate the decision often leads to a great deal of chatter and rapid back and
forth switching of decisions.
Function
blackcat L2 Ehlers Market Mode Identifier is used to identify market status is in Trend Mode or Cycle Mode.Since the Cycle Mode exists for the smallest fraction of time and since most traders make the most money following a trend rather than a cycle, it is best to assume that the market is in a Trend Mode unless some very specific criteria are met. There are only two criteria to establish a Cycle Mode. First, a Cycle Mode exists for the period of a half-dominant cycle after the crossing of the two Sinewave Indicator lines. Second, a Cycle Mode exists if the measured phase rate of change is more than two-thirds the phase rate of change of the dominant cycle (2*pi /Period) and is less
than 1.5 times the phase rate of change of the dominant cycle. There is another condition that defines a Trend Mode. This condition is derived from pragmatic observation, not theoretical considerations. When the market makes a major reversal, it often does this with great vigor. When this occurs, the prices have a wide separation from the Instantaneous Trendline. When the prices are widely separated from the Instantaneous Trendline, it is possible for the Cycle Mode conditions to be met-but the Cycle Mode identification is clearly incorrect. Dr. Ehlers have therefore inserted another overriding rule for these cases. That rule is that if the SmoothPrice (the 4-bar WMA of the Price) is separated by more than 1.5 percent from the Instantaneous Trendline, then the correct market mode is the Trend Mode.
Key Signal
Smooth --> 4 bar WMA w/ 1 bar lag
Detrender --> The amplitude response of a minimum-length HT can be improved by adjusting the filter coefficients by
trial and error. HT does not allow DC component at zero frequency for transformation. So, Detrender is used to remove DC component/ trend component.
Q1 --> Quadrature phase signal
I1 --> In-phase signal
Period --> Dominant Cycle in bars
SmoothPeriod --> Period with complex averaging
DCPeriod ---> Dominant Cycle Period
Trendline ---> IT fast line
SmoothPrice ---> IT slow line
Trend ---> Trend identifier: 1 for trend; 0 for cycle.
Pros and Cons
100% John F. Ehlers definition translation of original work, even variable names are the same. This help readers who would like to use pine to read his book. If you had read his works, then you will be quite familiar with my code style.
NOTE: I had tried several time frames, and found it did not work well for time frame < 1W.
Remarks
The 10th script for Blackcat1402 John F. Ehlers Week publication.
Readme
In real life, I am a prolific inventor. I have successfully applied for more than 60 international and regional patents in the past 12 years. But in the past two years or so, I have tried to transfer my creativity to the development of trading strategies. Tradingview is the ideal platform for me. I am selecting and contributing some of the hundreds of scripts to publish in Tradingview community. Welcome everyone to interact with me to discuss these interesting pine scripts.
The scripts posted are categorized into 5 levels according to my efforts or manhours put into these works.
Level 1 : interesting script snippets or distinctive improvement from classic indicators or strategy. Level 1 scripts can usually appear in more complex indicators as a function module or element.
Level 2 : composite indicator/strategy. By selecting or combining several independent or dependent functions or sub indicators in proper way, the composite script exhibits a resonance phenomenon which can filter out noise or fake trading signal to enhance trading confidence level.
Level 3 : comprehensive indicator/strategy. They are simple trading systems based on my strategies. They are commonly containing several or all of entry signal, close signal, stop loss, take profit, re-entry, risk management, and position sizing techniques. Even some interesting fundamental and mass psychological aspects are incorporated.
Level 4 : script snippets or functions that do not disclose source code. Interesting element that can reveal market laws and work as raw material for indicators and strategies. If you find Level 1~2 scripts are helpful, Level 4 is a private version that took me far more efforts to develop.
Level 5 : indicator/strategy that do not disclose source code. private version of Level 3 script with my accumulated script processing skills or a large number of custom functions. I had a private function library built in past two years. Level 5 scripts use many of them to achieve private trading strategy.
Background
John F. Ehlers introuced Market Mode Identifier in his "Rocket Science for Traders" chapter 11. The simplified model of the market, derived from the Drunkard's Walk problem, has only two modes-the Cycle Mode and the Trend Mode. Through the derivation of the Sinewave Indicator and the Instantaneous Trendline, Ehlers had shown several ways to estimate which mode the market may have for a given moment. As with most technical indicators, the decision point between modes is not clear-cut. In fact, trying to automate the decision often leads to a great deal of chatter and rapid back and
forth switching of decisions.
Function
blackcat L2 Ehlers Market Mode Identifier is used to identify market status is in Trend Mode or Cycle Mode.Since the Cycle Mode exists for the smallest fraction of time and since most traders make the most money following a trend rather than a cycle, it is best to assume that the market is in a Trend Mode unless some very specific criteria are met. There are only two criteria to establish a Cycle Mode. First, a Cycle Mode exists for the period of a half-dominant cycle after the crossing of the two Sinewave Indicator lines. Second, a Cycle Mode exists if the measured phase rate of change is more than two-thirds the phase rate of change of the dominant cycle (2*pi /Period) and is less
than 1.5 times the phase rate of change of the dominant cycle. There is another condition that defines a Trend Mode. This condition is derived from pragmatic observation, not theoretical considerations. When the market makes a major reversal, it often does this with great vigor. When this occurs, the prices have a wide separation from the Instantaneous Trendline. When the prices are widely separated from the Instantaneous Trendline, it is possible for the Cycle Mode conditions to be met-but the Cycle Mode identification is clearly incorrect. Dr. Ehlers have therefore inserted another overriding rule for these cases. That rule is that if the SmoothPrice (the 4-bar WMA of the Price) is separated by more than 1.5 percent from the Instantaneous Trendline, then the correct market mode is the Trend Mode.
Key Signal
Smooth --> 4 bar WMA w/ 1 bar lag
Detrender --> The amplitude response of a minimum-length HT can be improved by adjusting the filter coefficients by
trial and error. HT does not allow DC component at zero frequency for transformation. So, Detrender is used to remove DC component/ trend component.
Q1 --> Quadrature phase signal
I1 --> In-phase signal
Period --> Dominant Cycle in bars
SmoothPeriod --> Period with complex averaging
DCPeriod ---> Dominant Cycle Period
Trendline ---> IT fast line
SmoothPrice ---> IT slow line
Trend ---> Trend identifier: 1 for trend; 0 for cycle.
Pros and Cons
100% John F. Ehlers definition translation of original work, even variable names are the same. This help readers who would like to use pine to read his book. If you had read his works, then you will be quite familiar with my code style.
NOTE: I had tried several time frames, and found it did not work well for time frame < 1W.
Remarks
The 10th script for Blackcat1402 John F. Ehlers Week publication.
Readme
In real life, I am a prolific inventor. I have successfully applied for more than 60 international and regional patents in the past 12 years. But in the past two years or so, I have tried to transfer my creativity to the development of trading strategies. Tradingview is the ideal platform for me. I am selecting and contributing some of the hundreds of scripts to publish in Tradingview community. Welcome everyone to interact with me to discuss these interesting pine scripts.
The scripts posted are categorized into 5 levels according to my efforts or manhours put into these works.
Level 1 : interesting script snippets or distinctive improvement from classic indicators or strategy. Level 1 scripts can usually appear in more complex indicators as a function module or element.
Level 2 : composite indicator/strategy. By selecting or combining several independent or dependent functions or sub indicators in proper way, the composite script exhibits a resonance phenomenon which can filter out noise or fake trading signal to enhance trading confidence level.
Level 3 : comprehensive indicator/strategy. They are simple trading systems based on my strategies. They are commonly containing several or all of entry signal, close signal, stop loss, take profit, re-entry, risk management, and position sizing techniques. Even some interesting fundamental and mass psychological aspects are incorporated.
Level 4 : script snippets or functions that do not disclose source code. Interesting element that can reveal market laws and work as raw material for indicators and strategies. If you find Level 1~2 scripts are helpful, Level 4 is a private version that took me far more efforts to develop.
Level 5 : indicator/strategy that do not disclose source code. private version of Level 3 script with my accumulated script processing skills or a large number of custom functions. I had a private function library built in past two years. Level 5 scripts use many of them to achieve private trading strategy.
Notas de Lançamento
<b>OVERVIEW</b>This script identifies the market mode using Ehlers' method and highlights it with a background color on TradingView charts. It helps traders determine whether the market is in a trend or not.
<b>FEATURES</b>
- **Market Mode Calculation**: Uses Ehlers' method to determine if the market is in a trend.
- **Background Color Indicator**: Changes the background color of the chart to yellow when the market is in a trend, and black otherwise.
- **Input Options**: Allows users to select the source price (default is HL2).
<b>HOW TO USE</b>
1. Add the script to your TradingView chart.
2. Adjust the input settings if needed (e.g., changing the source price).
3. Observe the background color to identify market trends.
<b>LIMITATIONS</b>
- The script may not be accurate in all market conditions.
- It relies on historical data and may produce false signals.
Notas de Lançamento
█ OVERVIEWEhlers Market Mode Identifier classifies every bar as TREND mode or CYCLE mode, helping you match your tactics to the current market regime. This V2 release fixes the mode state machine and adds an interactive status table with richer visuals.
█ CONCEPTS
The script implements John Ehlers' market mode analysis: a Hilbert-transform In-phase/Quadrature decomposition measures the dominant cycle, and a trend state machine combines cycle phase behavior with price deviation from the instantaneous trendline.
Key principles:
• Dominant cycle length adapts bar by bar, bounded between 6 and 50 bars
• Cycle mode is favored while the dominant cycle sine stays coherent
• Sustained deviation from the instantaneous trendline flips the market to Trend mode
█ HOW TO USE
1 — Add the indicator to a regular price chart; it renders in its own pane.
2 — Read the colored strip and background: teal means Trend mode, orange means Cycle mode.
3 — Prefer breakout and trend-following tactics in Trend mode, and oscillator or reversion tactics in Cycle mode. The script is a research aid and does not create buy or sell orders.
Input Parameters
• Source: price series feeding the engine (default hl2)
• Trend Deviation Threshold (%): deviation from the instantaneous trendline that forces Trend mode (default 1.5%)
• Trend Mode Color / Cycle Mode Color: coloring for strips, sine, markers and background tint
• Show Dominant Cycle Sine Wave: plots the cycle sine (bold) against its 45-degree lead companion (gray)
• Show Market Mode Strips: full-height columns colored by the active mode
• Show Mode Change Markers: small circles on mode transitions
• Paint Background by Market Mode: faint pane tint per mode
• Show Status Table: on-chart regime dashboard with selectable position and text size
█ FEATURES
• Real-time status table: mode, bars in mode, dominant cycle length, cycle phase, phase rate, sine vs lead, price deviation and threshold
• Mode transition alertconditions for TREND and CYCLE entries
• Every visual element is toggleable; table position and font size are configurable
█ SIGNALS
Visual Elements
• Teal strip, circle or tint: Trend mode — momentum and breakout tactics are more reliable
• Orange strip, circle or tint: Cycle mode — price tends to oscillate between dominant cycle extremes
• Cycle sine above its lead companion: cycle is rising; crossings mark cycle turning points
█ IMPLEMENTATION NOTES
V2 corrections: mode state now persists bar to bar as in Ehlers' original formulation; sine crossovers are computed unconditionally for Pine v6 short-circuit safety; the deviation threshold is restored to the original 1.5%; zero-division guards and an explicit historical buffer were added. Built-ins used: math trigonometry, ta.crossover, ta.crossunder, ta.barssince, and table functions for the dashboard.
█ LIMITATIONS
• Regime detection confirms with roughly a half-cycle delay during transitions
• Best on liquid symbols from 15-minute to monthly charts; unreliable on very low timeframes
• A research tool, not a standalone trading system
█ NOTES
• Based on John F. Ehlers' cycle versus trend mode analysis from Cycle Analytics for Traders
• Open source under MPL 2.0 — attribution appreciated
═════════════════════════════════════════════════════════════════════════
For questions or feedback, use the comments section below.
Feel free to use and modify — attribution appreciated.

Don't miss out! The first and most important thing to do is to join my Discord chat now! Click here to start your adventure: discord.com/invite/ZTGpQJq My new github for more pine development soon: github.com/wxt-coder
Aviso legal
As informações e publicações não se destinam a ser, e não constituem, conselhos ou recomendações financeiras, de investimento, comerciais ou de outro tipo fornecidos ou endossados pela TradingView. Leia mais nos Termos de Uso.
Don't miss out! The first and most important thing to do is to join my Discord chat now! Click here to start your adventure: discord.com/invite/ZTGpQJq My new github for more pine development soon: github.com/wxt-coder
Aviso legal
As informações e publicações não se destinam a ser, e não constituem, conselhos ou recomendações financeiras, de investimento, comerciais ou de outro tipo fornecidos ou endossados pela TradingView. Leia mais nos Termos de Uso.