WallStreet 5/25 DMA Events by Danny Bee
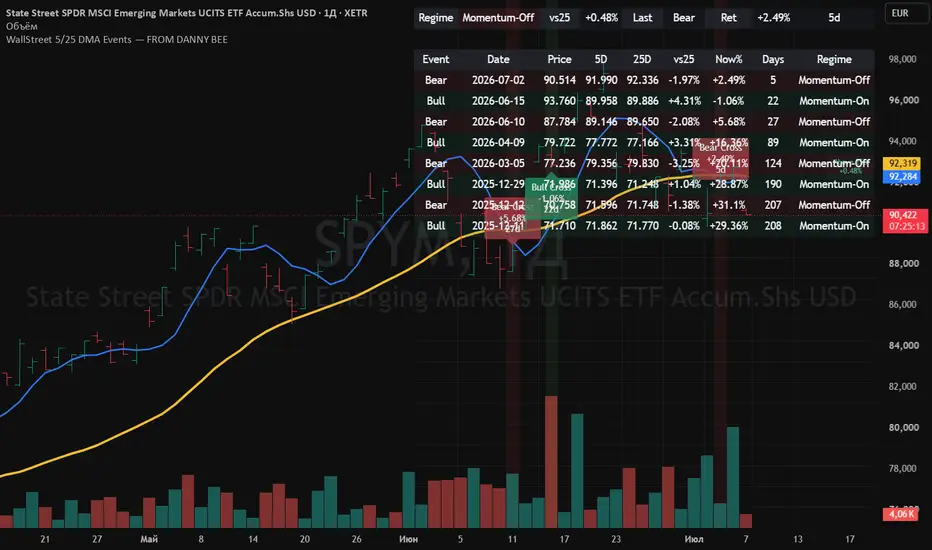
A fast momentum regime tool based on confirmed daily 5 DMA and 25 DMA cross events.
WallStreet 5/25 DMA Events — FROM DANNY BEE
This indicator is a fast momentum regime visualization tool based on the 5-day and 25-day moving averages.
It detects confirmed daily Bull Cross and Bear Cross events, plots the 5 DMA and 25 DMA on the chart, stores historical cross events, and tracks how price has performed since each event.
Main Features:
• Confirmed daily 5 DMA and 25 DMA
• Bull Cross and Bear Cross detection
• Momentum-On / Momentum-Off regime summary
• Historical event labels
• Event performance tracking from the cross price to the current price
• Current Close vs 25D distance label
• Event table with previous signals
• Customizable label detail: Minimal, Balanced, Detailed
• Customizable table position and text size
• Background highlight on new cross events
• Alerts for Bullish and Bearish 5/25 DMA cross events
How to Read It:
Bull Cross = 5 DMA crosses above 25 DMA
This usually represents short-term / swing momentum turning positive.
Bear Cross = 5 DMA crosses below 25 DMA
This usually represents short-term / swing momentum turning negative.
Momentum-On = 5 DMA is above or equal to 25 DMA
Momentum-Off = 5 DMA is below 25 DMA
The event table shows previous cross events, their date, event price, 5D value, 25D value, distance from 25D, return since the event, number of days passed, and the regime type.
Purpose:
This script is designed as a market context tool, not as an automatic trading system.
The 5/25 DMA structure is faster and more sensitive than classic long-term moving average systems such as 50/200 DMA. It may provide earlier momentum shifts, but it can also generate more noise and more frequent signals.
Use this indicator to observe short-term and swing momentum regimes, not to blindly buy or sell.
Alerts:
The script includes alert conditions for confirmed Bullish and Bearish 5/25 DMA cross events.
Suggested alert setting:
Condition: WallStreet 5/25 DMA Events — FROM DANNY BEE
Trigger: Once Per Bar Close
If dynamic alert messages are enabled in the script settings, alerts may include signal type, ticker, date, close, 5D, 25D, and distance from 25D.
Non-Repaint Design:
The indicator is designed to use confirmed daily data for its moving average values and cross events. This helps avoid signals based on unfinished daily candles.
TradingView may still show a general warning because the script uses higher timeframe data through request.security. This is normal for scripts that request daily data on lower timeframes.
Disclaimer:
This script is for educational and analytical purposes only. It is not financial advice. Markets involve risk, and past behavior after 5/25 DMA cross events does not guarantee future results.
Initial release.
Added confirmed daily 5/25 DMA momentum regime logic, Bull/Bear Cross events, historical labels, event table, Close vs 25D label, background highlights, and alert support.
WallStreet 5/25 DMA Events — FROM DANNY BEE
This indicator is a fast momentum regime visualization tool based on the 5-day and 25-day moving averages.
It detects confirmed daily Bull Cross and Bear Cross events, plots the 5 DMA and 25 DMA on the chart, stores historical cross events, and tracks how price has performed since each event.
Main Features:
• Confirmed daily 5 DMA and 25 DMA
• Bull Cross and Bear Cross detection
• Momentum-On / Momentum-Off regime summary
• Historical event labels
• Event performance tracking from the cross price to the current price
• Current Close vs 25D distance label
• Event table with previous signals
• Customizable label detail: Minimal, Balanced, Detailed
• Customizable table position and text size
• Background highlight on new cross events
• Alerts for Bullish and Bearish 5/25 DMA cross events
How to Read It:
Bull Cross = 5 DMA crosses above 25 DMA
This usually represents short-term / swing momentum turning positive.
Bear Cross = 5 DMA crosses below 25 DMA
This usually represents short-term / swing momentum turning negative.
Momentum-On = 5 DMA is above or equal to 25 DMA
Momentum-Off = 5 DMA is below 25 DMA
The event table shows previous cross events, their date, event price, 5D value, 25D value, distance from 25D, return since the event, number of days passed, and the regime type.
Purpose:
This script is designed as a market context tool, not as an automatic trading system.
The 5/25 DMA structure is faster and more sensitive than classic long-term moving average systems such as 50/200 DMA. It may provide earlier momentum shifts, but it can also generate more noise and more frequent signals.
Use this indicator to observe short-term and swing momentum regimes, not to blindly buy or sell.
Alerts:
The script includes alert conditions for confirmed Bullish and Bearish 5/25 DMA cross events.
Suggested alert setting:
Condition: WallStreet 5/25 DMA Events — FROM DANNY BEE
Trigger: Once Per Bar Close
If dynamic alert messages are enabled in the script settings, alerts may include signal type, ticker, date, close, 5D, 25D, and distance from 25D.
Non-Repaint Design:
The indicator is designed to use confirmed daily data for its moving average values and cross events. This helps avoid signals based on unfinished daily candles.
TradingView may still show a general warning because the script uses higher timeframe data through request.security. This is normal for scripts that request daily data on lower timeframes.
Disclaimer:
This script is for educational and analytical purposes only. It is not financial advice. Markets involve risk, and past behavior after 5/25 DMA cross events does not guarantee future results.
Initial release.
Added confirmed daily 5/25 DMA momentum regime logic, Bull/Bear Cross events, historical labels, event table, Close vs 25D label, background highlights, and alert support.

Aviso legal
As informações e publicações não se destinam a ser, e não constituem, conselhos ou recomendações financeiras, de investimento, comerciais ou de outro tipo fornecidos ou endossados pela TradingView. Leia mais nos Termos de Uso.
Aviso legal
As informações e publicações não se destinam a ser, e não constituem, conselhos ou recomendações financeiras, de investimento, comerciais ou de outro tipo fornecidos ou endossados pela TradingView. Leia mais nos Termos de Uso.