Dino Candle-Range BO
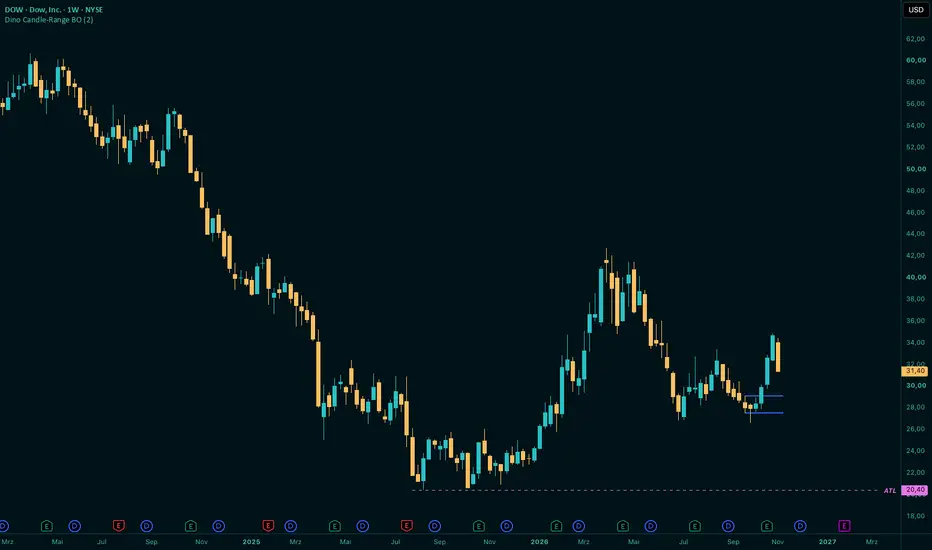
# Dino Candle-Range BO
**Automatic Candle Range Detection with Close-Based Breakout Logic**
Dino Candle-Range BO is a lightweight price action indicator designed to identify and visualize relevant candle ranges directly on your chart.
The indicator automatically determines a reference candle, plots its high and low as horizontal levels, and maintains those levels until a new valid range structure is established following a confirmed breakout.
**The concept is simple: Two levels. Clear structure. No unnecessary signals.**
### How It Works
**1. Candle Range Detection**
When a candle closes strictly within the high-low range of the preceding candle, that preceding candle becomes the reference candle.
**2. Range High & Low**
The high and low of the reference candle are plotted as horizontal lines and extended to the right.
**3. Close-Based Breakout**
A breakout is confirmed only when a candle closes above the range high or below the range low. Wick-only breakouts are ignored.
**4. Range Reset**
After a confirmed breakout, the existing levels remain visible.
A new reference candle is established only when a subsequent candle closes within the high-low range of its immediate predecessor.
The previous range is then automatically replaced.
### Key Features
- Automatic candle range detection
- Close-based breakout confirmation
- Dynamic high and low levels
- No wick-only breakout signals
- Levels remain active until a new valid range is established
- Customizable line colors and thickness
- Works directly on the selected chart timeframe
- No additional indicators or external data required
### Trading Applications
Dino Candle-Range BO provides a clean visual framework for analyzing price action, consolidation areas, and structural breakouts.
The identified levels can be used as additional context for:
- Breakout and reclaim setups
- Support and resistance analysis
- Market structure assessment
- Price action confirmation
The indicator is intended as a chart analysis tool and does not generate standalone buy or sell signals.
**Disclaimer:** This indicator is provided for educational and analytical purposes only and does not constitute financial advice.
---
*Developed by DinoTrading | Dino's Trading School*
**Automatic Candle Range Detection with Close-Based Breakout Logic**
Dino Candle-Range BO is a lightweight price action indicator designed to identify and visualize relevant candle ranges directly on your chart.
The indicator automatically determines a reference candle, plots its high and low as horizontal levels, and maintains those levels until a new valid range structure is established following a confirmed breakout.
**The concept is simple: Two levels. Clear structure. No unnecessary signals.**
### How It Works
**1. Candle Range Detection**
When a candle closes strictly within the high-low range of the preceding candle, that preceding candle becomes the reference candle.
**2. Range High & Low**
The high and low of the reference candle are plotted as horizontal lines and extended to the right.
**3. Close-Based Breakout**
A breakout is confirmed only when a candle closes above the range high or below the range low. Wick-only breakouts are ignored.
**4. Range Reset**
After a confirmed breakout, the existing levels remain visible.
A new reference candle is established only when a subsequent candle closes within the high-low range of its immediate predecessor.
The previous range is then automatically replaced.
### Key Features
- Automatic candle range detection
- Close-based breakout confirmation
- Dynamic high and low levels
- No wick-only breakout signals
- Levels remain active until a new valid range is established
- Customizable line colors and thickness
- Works directly on the selected chart timeframe
- No additional indicators or external data required
### Trading Applications
Dino Candle-Range BO provides a clean visual framework for analyzing price action, consolidation areas, and structural breakouts.
The identified levels can be used as additional context for:
- Breakout and reclaim setups
- Support and resistance analysis
- Market structure assessment
- Price action confirmation
The indicator is intended as a chart analysis tool and does not generate standalone buy or sell signals.
**Disclaimer:** This indicator is provided for educational and analytical purposes only and does not constitute financial advice.
---
*Developed by DinoTrading | Dino's Trading School*

Aviso legal
As informações e publicações não se destinam a ser, e não constituem, conselhos ou recomendações financeiras, de investimento, comerciais ou de outro tipo fornecidos ou endossados pela TradingView. Leia mais nos Termos de Uso.
Aviso legal
As informações e publicações não se destinam a ser, e não constituem, conselhos ou recomendações financeiras, de investimento, comerciais ou de outro tipo fornecidos ou endossados pela TradingView. Leia mais nos Termos de Uso.