OPEN-SOURCE SCRIPT
Atualizado Aurora SPI
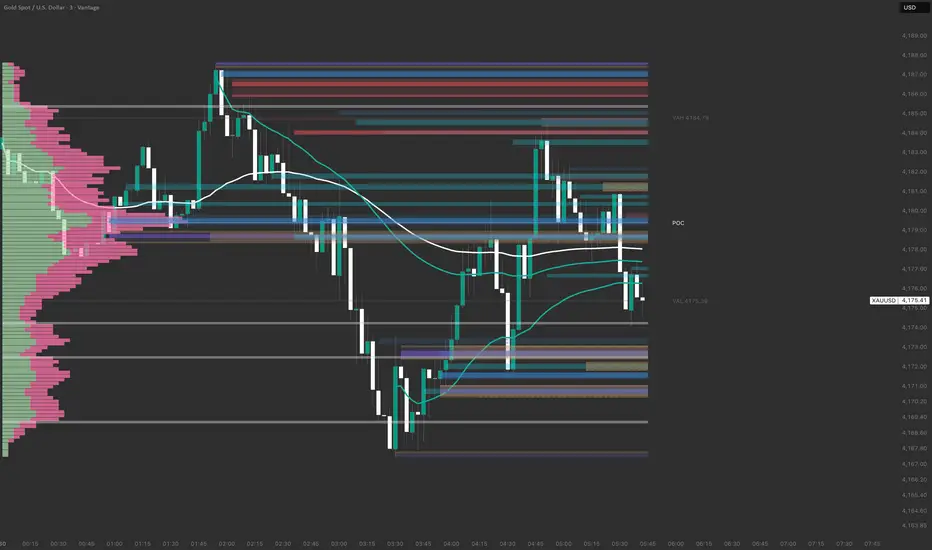
█ Aurora Profile
A session volume profile is often read as a histogram beside the chart: a prominent row, a value area, and perhaps a few obvious gaps. Aurora Profile starts with that same distribution and asks a more detailed question: what is happening inside its peaks, valleys, edges, and smaller corridors while the session is still forming?
The indicator turns the developing profile into a price map. It shows the volume distribution, POC, VAH, VAL, local volume zones, profile row levels, estimated directional participation, and three session based VWAP references together. Its purpose is to make the shape of the session easier to examine, from the broadest area of activity down to an individual price row.
Aurora Profile is designed especially for traders who work with intraday and CFD charts. It treats the profile as changing information. A zone represents a feature of the current distribution, not a permanent support or resistance promise.
█ Reading a session profile as a landscape
Volume at price describes where the available feed reported activity during the selected session. A large row says activity accumulated at that price. A thin row says comparatively little activity was allocated there. Neither observation, on its own, explains who is in control or what price must do next.
The relationship between neighboring rows gives the profile its structure. A high volume node can be a compact peak or part of a wider concentration. A low volume node can be a narrow gap or a corridor extending through several rows. Even a broad corridor may contain a particularly quiet row, a more active row, or a small pocket worth separating from the surrounding area.
Aurora Profile reads these relationships at several scales. The main profile provides the full session view. Its zones identify local formations above and below the current price. Optional row markers point to the lowest or highest measured volume inside a zone. Smaller areas and outer bands give a closer view of selected corridors. This lets the trader examine both the overall shape and the exact part of that shape price is approaching.
The profile starts at the configured session boundary. The default is 00:00 in Europe/Berlin. As volume arrives or the session high or low changes, the rows are recalculated and the profile zones are reconciled with the new distribution.
█ How activity is placed into price rows
The current session price range is divided into a configurable number of rows. Each analysis candle allocates its available volume across the rows touched by its high to low range. A candle spanning several rows contributes to each overlapping row rather than placing all of its volume at the close.
Pine Script®
This is a distribution model built from the available candles. It is not a trade by trade reconstruction. Smaller analysis candles can add detail when the feed provides them, while missing or unsuitable lower timeframe data falls back to the chart candle for the profile.
POC marks the price row with the largest allocated volume. The value area grows outward from POC, choosing the more active neighboring row until the selected fraction of session volume is included. VAH and VAL mark its upper and lower boundaries. The default value area target is 70 percent.
These levels are a starting point for reading the session. A trader can first locate the main concentration, then ask how the thinner areas, local peaks, and new activity relate to it.
█ From nodes to areas
LVN corridors
An LVN is a local valley relative to the profile rows around it. Aurora compares a potential low row with nearby shoulders, checks the required depth, and can expand the result into a wider low activity corridor. A broad LVN therefore appears as an area rather than a single arbitrary line.
HVN areas
An HVN is a local peak or concentration. Its prominence and minimum activity must meet the selected thresholds. Nearby active rows can form one compact area. The LVN and HVN scans examine both sides of the current price, so relevant structure can appear above or below the market.
High intensity local lows
The HIL module looks for a small dip between relatively active shoulders. It is separate from the standard LVN scan and is limited to one, two, or three profile rows. This can reveal a thin seam inside a denser part of the distribution.
High intensity corridor blocks
The HIB module is a separate search for a wider, multirow valley bounded by active shoulders. It draws the full qualifying block, then optionally marks the lowest volume row, highest volume row, or both within that block. Off, Lowest, Highest, and Both are available as modes. The original short HIL detector remains independent, so the compact dip and the wider corridor can each be assessed on their own terms.
Detail within and around a zone
A long LVN or HVN can contain a more specific local area. Aurora can shade that smaller area at the right end of the broader zone. Optional beige bands identify exactly one profile row immediately outside the top and bottom of an eligible LVN corridor. These are the edges beside the corridor, not extra LVN detections.
For LVN and HVN zones, dashed row markers can show the lowest and highest volume rows inside the area. The corresponding HIB markers use their own color setting. A line can remain inside its zone or use the longer POC span mode. The block and the row markers answer different questions: where is the whole formation, and where inside it is the selected volume extreme?
█ What a changing zone means
The profile is a live description of the current session. If new volume changes a valley or peak, the matching zone can adjust. If that feature disappears, its profile zone disappears too; if a new feature develops, Aurora can add it on a later scan. Profile areas are shown as Fresh or Visited. A price crossing does not erase a volume node by itself.
This behavior matters because a session profile is not a collection of fixed historical boxes. It is a distribution whose shape evolves. A zone may be worth examining because price reacts to it, but the profile itself must continue to support that zone as the session develops.
The optional smaller area inside a long zone helps distinguish the broad corridor from the row cluster currently standing out within it. A narrow HIL and a wider HIB can also coexist when their independent rules describe different scales of the same profile.
█ Directional pressure as an additional layer
The profile histogram can display estimated Buy and Sell portions of the available feed volume. Aurora also looks for a change in estimated directional dominance at the same price rows across two consecutive analysis windows. A Buy takeover requires prior Sell dominance, current Buy dominance, and confirmation from the selected number of recent analysis candles. A Sell takeover reverses those conditions.
Buy and Sell takeover areas are independent of the LVN, HVN, HIL, and HIB detections. A takeover can occur inside a profile node or elsewhere. Their states are Fresh, Touched, and Broken; broken takeover areas can be hidden or retained.
Compact labels identify the area and its volume. Hover over a label for modeled Buy and Sell proportions, approximate delta, zone state, visit information when enabled, and the analysis source. Labels sharing the exact same profile row move into adjacent columns; labels on different rows keep their normal positions.
Pine Script®
The default directional estimate relates price change to preceding rolling volatility and maps it through an approximate normal distribution. During warmup or when the estimate cannot be formed, the split is neutral. Candle direction and intrabar direction are alternative modes.
For CFDs, the feed may report tick activity or another provider specific volume measure. Aurora cannot verify executed aggressive orders from that series. Buy and Sell here describe modeled participation, not confirmed order flow or exchange footprint data.
█ VWAP references around the profile
Aurora includes a VWAP from the session start, a VWAP anchored at the latest session high, and a VWAP anchored at the latest session low. When a new high or low is made, the respective extreme anchor restarts.
Pine Script®
These paths give a second way to frame location. A low volume corridor near session VWAP is different context from a corridor far from session value. A return into an HVN while an extreme anchored VWAP moves through it can be examined differently from an isolated touch of the same node. VWAP does not change what the profile measured; it helps place that measurement in the session's price path.
█ A practical reading sequence
1. Define the session and confirm what the chart's volume series represents. The default reset is midnight Europe/Berlin.
2. Read the broad distribution first: POC, VAH, VAL, the main concentrations, and the gaps between them.
3. Inspect the relevant LVN and HVN areas. Ask whether a feature is a single row, a compact cluster, or a corridor.
4. Use HIL for a short local dip and HIB for a wider bounded corridor. In a block, compare the selected lowest and highest volume rows with its full height.
5. Check the smaller local area, any beige LVN edge bands, and the session or extreme anchored VWAP paths. They provide more precise location within the broad structure.
6. Read takeover zones and their tooltips as estimated pressure context. Watch how price interacts with the area; a colored box or a row line is not an entry instruction.
█ Controls and interpretation
The Profile settings control row resolution, histogram width, POC, value area, and display. Zone Detection controls LVN and HVN thresholds, smoothing, zone width, local areas, and row markers. High Intensity Profile Lows contains both the original short HIL scan and the independent corridor block module, including its row mode, shoulder search, contrast, and block height. The pressure settings control the comparison windows and confirmation. Theme presets are available for light and dark charts, with a custom mode for personal colors.
Aurora displays the latest session. Its profile and profile zones may change while that session develops. Pressure events commit on closed chart candles; live tooltip values can be provisional. Results also depend on timeframe, available lower timeframe candles, and the volume series supplied by the chart provider.
Aurora Profile is a way to read more of the session's volume structure. Use its areas as context for observation, confirmation, and your own risk process rather than as promises about the next price move.
A session volume profile is often read as a histogram beside the chart: a prominent row, a value area, and perhaps a few obvious gaps. Aurora Profile starts with that same distribution and asks a more detailed question: what is happening inside its peaks, valleys, edges, and smaller corridors while the session is still forming?
The indicator turns the developing profile into a price map. It shows the volume distribution, POC, VAH, VAL, local volume zones, profile row levels, estimated directional participation, and three session based VWAP references together. Its purpose is to make the shape of the session easier to examine, from the broadest area of activity down to an individual price row.
Aurora Profile is designed especially for traders who work with intraday and CFD charts. It treats the profile as changing information. A zone represents a feature of the current distribution, not a permanent support or resistance promise.
█ Reading a session profile as a landscape
Volume at price describes where the available feed reported activity during the selected session. A large row says activity accumulated at that price. A thin row says comparatively little activity was allocated there. Neither observation, on its own, explains who is in control or what price must do next.
The relationship between neighboring rows gives the profile its structure. A high volume node can be a compact peak or part of a wider concentration. A low volume node can be a narrow gap or a corridor extending through several rows. Even a broad corridor may contain a particularly quiet row, a more active row, or a small pocket worth separating from the surrounding area.
Aurora Profile reads these relationships at several scales. The main profile provides the full session view. Its zones identify local formations above and below the current price. Optional row markers point to the lowest or highest measured volume inside a zone. Smaller areas and outer bands give a closer view of selected corridors. This lets the trader examine both the overall shape and the exact part of that shape price is approaching.
The profile starts at the configured session boundary. The default is 00:00 in Europe/Berlin. As volume arrives or the session high or low changes, the rows are recalculated and the profile zones are reconciled with the new distribution.
█ How activity is placed into price rows
The current session price range is divided into a configurable number of rows. Each analysis candle allocates its available volume across the rows touched by its high to low range. A candle spanning several rows contributes to each overlapping row rather than placing all of its volume at the close.
This is a distribution model built from the available candles. It is not a trade by trade reconstruction. Smaller analysis candles can add detail when the feed provides them, while missing or unsuitable lower timeframe data falls back to the chart candle for the profile.
POC marks the price row with the largest allocated volume. The value area grows outward from POC, choosing the more active neighboring row until the selected fraction of session volume is included. VAH and VAL mark its upper and lower boundaries. The default value area target is 70 percent.
These levels are a starting point for reading the session. A trader can first locate the main concentration, then ask how the thinner areas, local peaks, and new activity relate to it.
█ From nodes to areas
LVN corridors
An LVN is a local valley relative to the profile rows around it. Aurora compares a potential low row with nearby shoulders, checks the required depth, and can expand the result into a wider low activity corridor. A broad LVN therefore appears as an area rather than a single arbitrary line.
HVN areas
An HVN is a local peak or concentration. Its prominence and minimum activity must meet the selected thresholds. Nearby active rows can form one compact area. The LVN and HVN scans examine both sides of the current price, so relevant structure can appear above or below the market.
High intensity local lows
The HIL module looks for a small dip between relatively active shoulders. It is separate from the standard LVN scan and is limited to one, two, or three profile rows. This can reveal a thin seam inside a denser part of the distribution.
High intensity corridor blocks
The HIB module is a separate search for a wider, multirow valley bounded by active shoulders. It draws the full qualifying block, then optionally marks the lowest volume row, highest volume row, or both within that block. Off, Lowest, Highest, and Both are available as modes. The original short HIL detector remains independent, so the compact dip and the wider corridor can each be assessed on their own terms.
Detail within and around a zone
A long LVN or HVN can contain a more specific local area. Aurora can shade that smaller area at the right end of the broader zone. Optional beige bands identify exactly one profile row immediately outside the top and bottom of an eligible LVN corridor. These are the edges beside the corridor, not extra LVN detections.
For LVN and HVN zones, dashed row markers can show the lowest and highest volume rows inside the area. The corresponding HIB markers use their own color setting. A line can remain inside its zone or use the longer POC span mode. The block and the row markers answer different questions: where is the whole formation, and where inside it is the selected volume extreme?
█ What a changing zone means
The profile is a live description of the current session. If new volume changes a valley or peak, the matching zone can adjust. If that feature disappears, its profile zone disappears too; if a new feature develops, Aurora can add it on a later scan. Profile areas are shown as Fresh or Visited. A price crossing does not erase a volume node by itself.
This behavior matters because a session profile is not a collection of fixed historical boxes. It is a distribution whose shape evolves. A zone may be worth examining because price reacts to it, but the profile itself must continue to support that zone as the session develops.
The optional smaller area inside a long zone helps distinguish the broad corridor from the row cluster currently standing out within it. A narrow HIL and a wider HIB can also coexist when their independent rules describe different scales of the same profile.
█ Directional pressure as an additional layer
The profile histogram can display estimated Buy and Sell portions of the available feed volume. Aurora also looks for a change in estimated directional dominance at the same price rows across two consecutive analysis windows. A Buy takeover requires prior Sell dominance, current Buy dominance, and confirmation from the selected number of recent analysis candles. A Sell takeover reverses those conditions.
Buy and Sell takeover areas are independent of the LVN, HVN, HIL, and HIB detections. A takeover can occur inside a profile node or elsewhere. Their states are Fresh, Touched, and Broken; broken takeover areas can be hidden or retained.
Compact labels identify the area and its volume. Hover over a label for modeled Buy and Sell proportions, approximate delta, zone state, visit information when enabled, and the analysis source. Labels sharing the exact same profile row move into adjacent columns; labels on different rows keep their normal positions.
The default directional estimate relates price change to preceding rolling volatility and maps it through an approximate normal distribution. During warmup or when the estimate cannot be formed, the split is neutral. Candle direction and intrabar direction are alternative modes.
For CFDs, the feed may report tick activity or another provider specific volume measure. Aurora cannot verify executed aggressive orders from that series. Buy and Sell here describe modeled participation, not confirmed order flow or exchange footprint data.
█ VWAP references around the profile
Aurora includes a VWAP from the session start, a VWAP anchored at the latest session high, and a VWAP anchored at the latest session low. When a new high or low is made, the respective extreme anchor restarts.
These paths give a second way to frame location. A low volume corridor near session VWAP is different context from a corridor far from session value. A return into an HVN while an extreme anchored VWAP moves through it can be examined differently from an isolated touch of the same node. VWAP does not change what the profile measured; it helps place that measurement in the session's price path.
█ A practical reading sequence
1. Define the session and confirm what the chart's volume series represents. The default reset is midnight Europe/Berlin.
2. Read the broad distribution first: POC, VAH, VAL, the main concentrations, and the gaps between them.
3. Inspect the relevant LVN and HVN areas. Ask whether a feature is a single row, a compact cluster, or a corridor.
4. Use HIL for a short local dip and HIB for a wider bounded corridor. In a block, compare the selected lowest and highest volume rows with its full height.
5. Check the smaller local area, any beige LVN edge bands, and the session or extreme anchored VWAP paths. They provide more precise location within the broad structure.
6. Read takeover zones and their tooltips as estimated pressure context. Watch how price interacts with the area; a colored box or a row line is not an entry instruction.
█ Controls and interpretation
The Profile settings control row resolution, histogram width, POC, value area, and display. Zone Detection controls LVN and HVN thresholds, smoothing, zone width, local areas, and row markers. High Intensity Profile Lows contains both the original short HIL scan and the independent corridor block module, including its row mode, shoulder search, contrast, and block height. The pressure settings control the comparison windows and confirmation. Theme presets are available for light and dark charts, with a custom mode for personal colors.
Aurora displays the latest session. Its profile and profile zones may change while that session develops. Pressure events commit on closed chart candles; live tooltip values can be provisional. Results also depend on timeframe, available lower timeframe candles, and the volume series supplied by the chart provider.
Aurora Profile is a way to read more of the session's volume structure. Use its areas as context for observation, confirmation, and your own risk process rather than as promises about the next price move.
Notas de Lançamento
Performance improvements , cleaner visual defaults , added a new cluster zone , Notas de Lançamento
New defaultsNotas de Lançamento
Better Labels for Profile , POC , VAH , VAL Notas de Lançamento
changed defaults Notas de Lançamento
Changed defaults Script de código aberto
Em verdadeiro espírito do TradingView, o criador deste script o tornou de código aberto, para que os traders possam revisar e verificar sua funcionalidade. Parabéns ao autor! Embora você possa usá-lo gratuitamente, lembre-se de que a republicação do código está sujeita às nossas Regras da Casa.

Aviso legal
As informações e publicações não se destinam a ser, e não constituem, conselhos ou recomendações financeiras, de investimento, comerciais ou de outro tipo fornecidos ou endossados pela TradingView. Leia mais nos Termos de Uso.
Script de código aberto
Em verdadeiro espírito do TradingView, o criador deste script o tornou de código aberto, para que os traders possam revisar e verificar sua funcionalidade. Parabéns ao autor! Embora você possa usá-lo gratuitamente, lembre-se de que a republicação do código está sujeita às nossas Regras da Casa.
Aviso legal
As informações e publicações não se destinam a ser, e não constituem, conselhos ou recomendações financeiras, de investimento, comerciais ou de outro tipo fornecidos ou endossados pela TradingView. Leia mais nos Termos de Uso.