Atualizado
ICT Midnight Opening Range & Standard Deviation [TradeSymmetry]
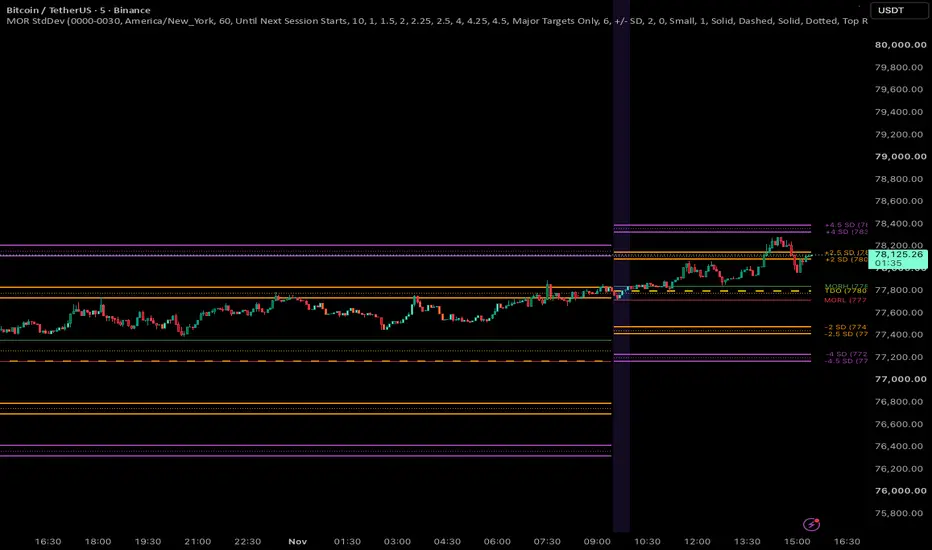
Overview
The ICT Midnight Opening Range & Standard Deviation Projections is an institutional trading indicator designed around Michael J. Huddleston’s (ICT) True Day Open (TDO) and Midnight Opening Range (MOR) concepts.
Anchored to the 00:00 New York Midnight candle, this indicator establishes the foundational range for the algorithmic trading day and projects institutional standard deviation expansion targets across both sessions (London & New York).
Core Concepts & Methodology
Key Features
How to Trade It
Disclaimer
This indicator is designed for educational and analytical purposes only. It does not constitute financial advice. Always practice sound risk management and backtest with your own trading plan.
The ICT Midnight Opening Range & Standard Deviation Projections is an institutional trading indicator designed around Michael J. Huddleston’s (ICT) True Day Open (TDO) and Midnight Opening Range (MOR) concepts.
Anchored to the 00:00 New York Midnight candle, this indicator establishes the foundational range for the algorithmic trading day and projects institutional standard deviation expansion targets across both sessions (London & New York).
Core Concepts & Methodology
- 00:00 True Day Open (TDO):
- Fixed to the New York Midnight Open (00:00 EST/EDT).
- Used as the institutional benchmark:
- Above TDO: Premium pricing (look for short setups / Judas swing highs).
- Below TDO: Discount pricing (look for long setups / Judas swing lows).
- Midnight Opening Range (MOR):
- Calculated during the first 30 minutes of the algorithmic day (00:00–00:30 New York).
- Captures the initial liquidity bounds: MOR High (MORH), MOR Low (MORL), and the 50% Equilibrium (MORM).
- Standard Deviation Projections:
- Measured as multiples of the MOR range distance (Delta = MORH - MORL):
- 1.00 & 1.50 SD: Immediate session continuation milestones.
- 2.00 – 2.50 SD (Primary Reaction Zone): Shaded institutional profit-taking and reversal exhaustion zone.
- 4.00 – 4.50 SD (Macro Expansion Zone): Shaded extreme trending / macro day liquidity runs.
- Measured as multiples of the MOR range distance (Delta = MORH - MORL):
Key Features
- Continuous Line Extension: Horizontal projection lines cleanly extend across the day right up until the next session begins (matching the popular Initial Balance style).
- Decluttered Label Engine:
- Horizontal Staggering: Automatically offsets alternate labels forward (+6 bars) so adjacent target prices never overlap.
- Label Filtering: Option to display Major Targets Only, Key Targets Only, or All Levels.
- Mitigation Purge: Optionally hides target labels once price trades through them.
- Multi-Day History: Displays up to 20 historical days with clean range boxes and reaction zones without cluttering your chart.
- Live Dashboard Table: Displays live session status, TDO, MOR High, MOR Low, Range point size, and Current Market Bias (Premium / Discount / Equilibrium).
- Integrated Alerts: Alerts for MOR range formation, High/Low breakouts, and 2.0 SD target hits.
How to Trade It
- Judas Swing Identification: During London session (02:00–05:00 NY), watch for a manipulation drive across TDO into opposite liquidity before the true trend unfolds.
- Targeting Standard Deviations:
- If price expands out of the MOR during London or NY session, use the 2.0–2.5 SD zone as high-probability take-profit targets.
- Reversals often form within the shaded 2.0–2.5 SD and 4.0–4.5 SD exhaustion zones.
Disclaimer
This indicator is designed for educational and analytical purposes only. It does not constitute financial advice. Always practice sound risk management and backtest with your own trading plan.
Notas de Lançamento
make line color configurableNotas de Lançamento
Cross-Timeframe Session SynchronizationNotas de Lançamento
📊 Volume Weighted Colored BarsInstitutional Volume Detection: Added an integrated Volume-Weighted Bar coloring engine based on volume moving average relative thresholds:
High Volume Bullish (Dark Green): Institutional buying pressure & potential breakout continuation.
High Volume Bearish (Dark Red): Institutional selling pressure & strong distribution.
Low Volume Bullish (Aquamarine) & Bearish (Orange): Low-volume churn, consolidation, or exhaustion.
Fully Customizable: Easily adjust the Volume SMA Length (default 89), High Multiplier (1.618), Low Multiplier (0.618), and individual bar colors in settings.

Aviso legal
As informações e publicações não se destinam a ser, e não constituem, conselhos ou recomendações financeiras, de investimento, comerciais ou de outro tipo fornecidos ou endossados pela TradingView. Leia mais nos Termos de Uso.
Aviso legal
As informações e publicações não se destinam a ser, e não constituem, conselhos ou recomendações financeiras, de investimento, comerciais ou de outro tipo fornecidos ou endossados pela TradingView. Leia mais nos Termos de Uso.