OPEN-SOURCE SCRIPT
Auto-Anchored VWAP with Bands & Dashboard
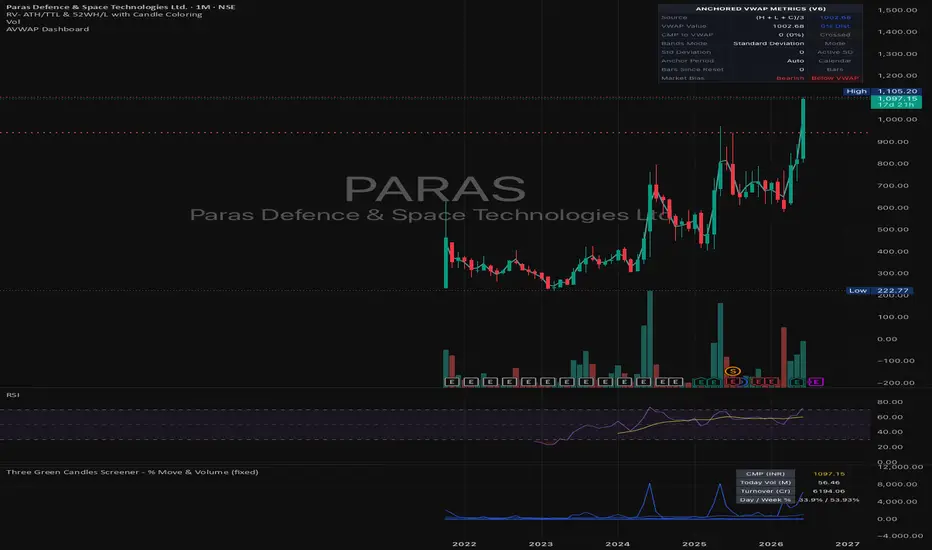
Overview
The Auto-Anchored VWAP with Bands & Dashboard is a premium, high-performance technical analysis tool designed for TradingView (Pine Script v6). It calculates the Volume Weighted Average Price (VWAP) along with three customizable Standard Deviation (or Percentage) bands, starting from dynamic anchoring conditions. It also features a floating, real-time metrics dashboard on your screen to track distance, volatility, and trend bias, as well as optional chart coloring and crossover signals.
Key Functional Areas
1. Dynamic Anchoring System
Unlike standard VWAP indicators that reset only at the start of the day, this script lets you select how and when the VWAP calculation resets:
Calendar Boundaries: Automatically resets calculations at the start of a Session (Day), Week, Month, Quarter, Year, Decade, or Century.
Auto Mode: Detects your chart timeframe—resets daily on intraday charts (1m, 5m, 1h, etc.) and monthly on higher resolution charts (Daily, Weekly, etc.).
Lookback Back-Scanning: Scans a lookback window (e.g., the last 14 bars) to anchor the VWAP at the exact bar where the Highest High, Lowest Low, or Highest Volume occurred.
Corporate Events: Resets the calculation on the exact bar when new corporate Earnings, Dividend payouts, or Stock Splits are announced (ideal for stock traders).
2. Multi-Bands & Custom Price Sources
Dropdown Source Selection: Select your calculation price source, including Open, High, Low, Close, (H+L)/2, (H+L+C)/3 (Typical Price), (O+H+L+C)/4, or (H+L+C+C)/4 (Weighted Close).
3 Independent Bands: Toggle up to three bands above and below the VWAP using Standard Deviation multipliers or percentage offsets.
Visual Highlights: Colors the area between the upper and lower Band #1 with a transparent green background to highlight the core trading range.
3. Floating Metrics Dashboard
A clean, dark glassmorphic table floats in your selected corner of the chart (e.g., Top Right) to summarize current market conditions:
Source: The current value of the selected price source.
VWAP Value: The exact price of the VWAP line.
CMP to VWAP (Current Market Price): Displays how far the current price is from the VWAP line in absolute points/pips and as a percentage, color-coded green (above) or red (below).
Bands Mode & Volatility: Shows whether bands are Standard Deviation or Percentage based, and the current value of the standard deviation.
Anchor Type & Length: Displays the selected anchor period and the lookback length.
Bars Since Reset: Shows exactly how many bars have passed since the VWAP calculation started or reset.
Market Bias: Displays a clear Bullish (Above VWAP) or Bearish (Below VWAP) trend bias.
The Auto-Anchored VWAP with Bands & Dashboard is a premium, high-performance technical analysis tool designed for TradingView (Pine Script v6). It calculates the Volume Weighted Average Price (VWAP) along with three customizable Standard Deviation (or Percentage) bands, starting from dynamic anchoring conditions. It also features a floating, real-time metrics dashboard on your screen to track distance, volatility, and trend bias, as well as optional chart coloring and crossover signals.
Key Functional Areas
1. Dynamic Anchoring System
Unlike standard VWAP indicators that reset only at the start of the day, this script lets you select how and when the VWAP calculation resets:
Calendar Boundaries: Automatically resets calculations at the start of a Session (Day), Week, Month, Quarter, Year, Decade, or Century.
Auto Mode: Detects your chart timeframe—resets daily on intraday charts (1m, 5m, 1h, etc.) and monthly on higher resolution charts (Daily, Weekly, etc.).
Lookback Back-Scanning: Scans a lookback window (e.g., the last 14 bars) to anchor the VWAP at the exact bar where the Highest High, Lowest Low, or Highest Volume occurred.
Corporate Events: Resets the calculation on the exact bar when new corporate Earnings, Dividend payouts, or Stock Splits are announced (ideal for stock traders).
2. Multi-Bands & Custom Price Sources
Dropdown Source Selection: Select your calculation price source, including Open, High, Low, Close, (H+L)/2, (H+L+C)/3 (Typical Price), (O+H+L+C)/4, or (H+L+C+C)/4 (Weighted Close).
3 Independent Bands: Toggle up to three bands above and below the VWAP using Standard Deviation multipliers or percentage offsets.
Visual Highlights: Colors the area between the upper and lower Band #1 with a transparent green background to highlight the core trading range.
3. Floating Metrics Dashboard
A clean, dark glassmorphic table floats in your selected corner of the chart (e.g., Top Right) to summarize current market conditions:
Source: The current value of the selected price source.
VWAP Value: The exact price of the VWAP line.
CMP to VWAP (Current Market Price): Displays how far the current price is from the VWAP line in absolute points/pips and as a percentage, color-coded green (above) or red (below).
Bands Mode & Volatility: Shows whether bands are Standard Deviation or Percentage based, and the current value of the standard deviation.
Anchor Type & Length: Displays the selected anchor period and the lookback length.
Bars Since Reset: Shows exactly how many bars have passed since the VWAP calculation started or reset.
Market Bias: Displays a clear Bullish (Above VWAP) or Bearish (Below VWAP) trend bias.
Script de código aberto
Em verdadeiro espírito do TradingView, o criador deste script o tornou de código aberto, para que os traders possam revisar e verificar sua funcionalidade. Parabéns ao autor! Embora você possa usá-lo gratuitamente, lembre-se de que a republicação do código está sujeita às nossas Regras da Casa.

Aviso legal
As informações e publicações não se destinam a ser, e não constituem, conselhos ou recomendações financeiras, de investimento, comerciais ou de outro tipo fornecidos ou endossados pela TradingView. Leia mais nos Termos de Uso.
Script de código aberto
Em verdadeiro espírito do TradingView, o criador deste script o tornou de código aberto, para que os traders possam revisar e verificar sua funcionalidade. Parabéns ao autor! Embora você possa usá-lo gratuitamente, lembre-se de que a republicação do código está sujeita às nossas Regras da Casa.
Aviso legal
As informações e publicações não se destinam a ser, e não constituem, conselhos ou recomendações financeiras, de investimento, comerciais ou de outro tipo fornecidos ou endossados pela TradingView. Leia mais nos Termos de Uso.