Atualizado
Trendline and SR System [BullByte]
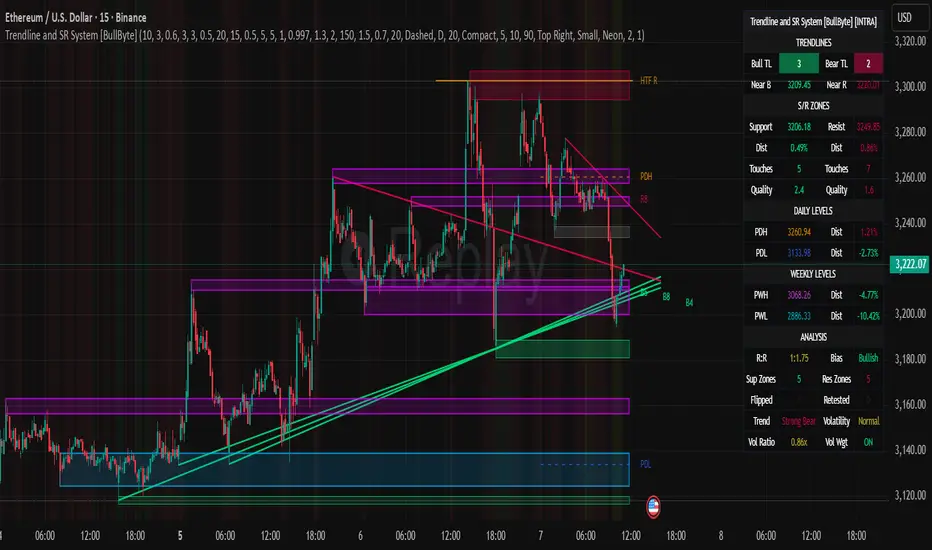
TRENDLINE AND SR SYSTEM [BULLBYTE]
From Manual Drawing to Intelligent Automation
═════════════════════════════════════════════════════════════
OVERVIEW
This indicator automates years of manual chart work: detecting trendlines, forming support/resistance zones, tracking zone lifecycles, and scoring touches by quality. Instead of counting touches equally, the system weights them by precision, reaction type and volume so a high-volume wick rejection gets more influence than a low-volume consolidation.
The core philosophy is simple: not all touches are equal. A wick rejection at high volume carries more weight than a body consolidation at low volume. A zone that held three times deserves more attention than one that just formed. This indicator captures that nuanced approach through a quality-weighted touch scoring system.
═════════════════════════════════════════════════════════════
THE PROBLEM THIS SOLVES
Manual technical analysis presents several challenges:
1. Time Consumption - Drawing and updating trendlines across multiple assets and timeframes is labor-intensive
2. Subjectivity - Two traders often draw different lines on the same chart
3. Inconsistency - Fatigue leads to missed levels or inconsistent criteria
4. Delayed Updates - Manually tracking when zones break, get retested, or flip takes constant attention
This system addresses each challenge by applying consistent mathematical criteria to every potential level, updating in real-time, and tracking zone lifecycle automatically.
═════════════════════════════════════════════════════════════
HOW IT WORKS
--- TRENDLINE DETECTION ---
The system identifies trendlines through a multi-step process:
Step 1: Pivot Detection
The indicator scans for significant swing highs and swing lows using a sensitivity parameter that automatically scales based on your chart timeframe. Shorter timeframes use faster detection, while daily charts use slower, more significant pivots.
Step 2: Line Validation
For each pair of pivots, the system calculates:
- Slope direction (upward for bullish, downward for bearish)
- Current relevance (is the projected line near current price?)
- Minimum touch requirements
Step 3: Touch Quality Scoring
This is where the system differs from simple trendline indicators. Each touch is scored based on:
Precision: How close did price get to the line? A touch at the exact line scores 1.0, while a touch at the edge of tolerance scores lower.
Reaction Type: The system classifies touches into categories:
* Wick Rejection (1.0) - Wick touched but body stayed outside
* Body Rejection (0.8) - Body touched but closed with reaction
* False Break (1.2) - Price broke through then recovered (strongest signal)
* Consolidation (0.5) - Price lingered without clear rejection
Volume Weight: When volume integration is enabled, high-volume touches receive a boost (up to 1.5x), while low-volume touches are discounted (down to 0.5x).
Step 4: Display Filtering
Only trendlines meeting minimum touch count AND minimum average precision are displayed. This eliminates weak, coincidental alignments.
--- SUPPORT AND RESISTANCE ZONES ---
Zones are detected from pivot points and horizontal level clustering:
Pivot-Based Zones:
When a significant pivot forms, a zone is created around that price level. Zone height is calculated as an ATR multiple, automatically scaling with volatility.
Cluster-Based Zones:
The system scans historical bars to find where multiple highs or lows align within tolerance. These horizontal rejection clusters often mark institutional interest levels.
Zone Merging:
When two zones are within a configurable distance, they merge into one stronger zone rather than cluttering the chart.
--- ZONE LIFECYCLE MANAGEMENT ---
This is the core innovation. Zones progress through states:
ACTIVE: Newly formed zone, not yet validated
TESTED: Zone has received 3+ quality touches, proving its relevance
BROKEN: Price closed through the zone
RETESTED: Price returned to test the broken zone
FLIPPED: Former support now acts as resistance (or vice versa)
Each state is visually distinct:
- Active zones show in standard support/resistance colors
- Tested zones show in blue with thicker borders
- Broken zones fade to gray
- Retested zones show in orange
- Flipped zones show in purple
Zone Decay:
Zones that price ignores gradually lose strength. The decay rate is configurable (default 0.997 per bar). This means a zone loses roughly half its strength after 230 bars of no interaction. This prevents old, irrelevant levels from cluttering your chart.
Zone Reactivation:
If price returns to a decayed zone, it receives a strength boost, recognizing that the level remains relevant.
═════════════════════════════════════════════════════════════
READING THE VISUAL ELEMENTS
--- TRENDLINES ---
Label Format: [Type][Touches][Status]
Examples:
- B3 = Bullish trendline with 3 touches (active)
- B5x = Bullish trendline with 5 touches (broken)
- R4 = Bearish/Resistance trendline with 4 touches (active)
Line Thickness:
- Thin lines = 2-3 touches
- Thick lines = 4+ touches (higher significance)
Line Style:
- Solid = Active trendline
- Dotted = Broken trendline

--- ZONES ---
Label Format: [Type][Touches][Status]
Examples:
- S2 = Support zone with 2 touches (active)
- S4+ = Support zone with 4 touches (tested/validated)
- R3x = Resistance zone with 3 touches (broken)
- S5r = Support zone retested after break
- R4f = Resistance zone that flipped to support
Border Thickness:
- Thin border = Standard zone
- Thick border = Validated zone (3+ touches or high volume)
Zone Colors by State:
- Teal/Green shades = Support zones
- Red shades = Resistance zones
- Blue = Tested/validated zones
- Gray = Broken zones
- Orange = Retested zones
- Purple = Flipped zones
--- DAILY AND WEEKLY LEVELS ---
PDH = Previous Day High
PDL = Previous Day Low
PWH = Previous Week High
PWL = Previous Week Low
HTF R = Higher Timeframe Resistance
HTF S = Higher Timeframe Support
These levels use dashed lines by default and extend from the period open.

--- BREAKOUT MARKERS ---
When a trendline breaks, the system places a "BRK" label at the breakout point.
Marker Size (when volume integration enabled):
- Tiny = Normal volume breakout
- Small = Above-average volume breakout
- Normal = High volume breakout (1.5x+ average)
Recent breakouts show full labels; older breakouts show as dots.

═════════════════════════════════════════════════════════════
THE DASHBOARD EXPLAINED
The information panel displays real-time metrics organized in sections:
--- TRENDLINES SECTION ---
Bull TL: Count of active bullish trendlines
Bear TL: Count of active bearish trendlines
Near B: Price level of nearest bullish trendline
Near R: Price level of nearest bearish trendline
--- S/R ZONES SECTION ---
Support: Nearest support zone price
Resist: Nearest resistance zone price
Dist: Percentage distance to each zone
Touches: Touch count of nearest zones
Quality: Quality score of nearest zones (higher = stronger)
--- DAILY LEVELS SECTION ---
PDH/PDL: Previous day high and low prices
Dist: Percentage distance from current price
Green percentage = price is above the level
Red percentage = price is below the level
--- WEEKLY LEVELS SECTION ---
PWH/PWL: Previous week high and low prices
Dist: Percentage distance from current price
--- ANALYSIS SECTION ---
R:R: Risk-to-Reward ratio based on distance to nearest support (risk) and resistance (reward). Ratios of 2:1 or higher show in green.
Bias: Market direction assessment based on:
- Trendline count comparison
- Distance to support vs resistance
- Zone quality comparison
- Price position relative to 50 SMA
Sup Zones / Res Zones: Count of active zones
Flipped / Retested: Count of zones in these states
Trend: Trend strength based on moving average alignment (Strong Bull to Strong Bear)
Volatility: Current ATR relative to 50-period average (High/Normal/Low)
Vol Ratio: Current volume relative to 20-period average
Vol Wgt: Volume weighting status (ON/OFF)
═════════════════════════════════════════════════════════════
TIMEFRAME ADAPTATION
The indicator automatically adjusts its parameters based on your chart timeframe:
SCALP MODE (Under 15 minutes)
- Faster pivot detection
- Tighter zone heights
- More responsive to recent price action
- Dashboard shows [SCALP] tag
INTRADAY MODE (15 minutes to 1 hour)
- Standard parameters
- Balanced sensitivity
- Dashboard shows [INTRA] tag
SWING MODE (1 hour to 4 hours)
- Slower pivot detection
- Wider zone heights
- Focus on more significant levels
- Dashboard shows [SWING] tag
POSITION MODE (Daily and above)
- Slowest detection for major levels only
- Widest zones for higher timeframe context
- Dashboard shows [POS] tag
This means you can use the same settings across all timeframes, and the indicator adapts appropriately.
═════════════════════════════════════════════════════════════
SETTINGS GUIDE
--- TRENDLINE SETTINGS ---
Show Trendlines: Master toggle for all trendline visibility
Base Pivot Sensitivity: Controls how many bars the system looks back to identify pivots. Lower values find more pivots; higher values find only significant ones. Default 10 works well for most cases.
Minimum Touches: How many touches a trendline needs before displaying. Default 3 filters out weak lines.
Minimum Precision Score: Average touch quality required. Range 0.3 to 0.95. Default 0.6 provides good balance. Higher values show only the most precise trendlines.
Max Bullish/Bearish Trendlines: Limits how many lines display to prevent clutter.
Touch Tolerance ATR Mult: How close price must get to count as a touch, measured in ATR. Default 0.5 ATR works for most markets.
Extend Lines Right: Whether trendlines project into the future.
--- SUPPORT RESISTANCE SETTINGS ---
Show SR Zones: Master toggle for zone visibility
Base Zone Detection Length: Pivot lookback for zone creation. Similar to trendline sensitivity.
Base Zone Height ATR Mult: How tall zones are, as ATR multiple. Default 0.5 ATR. Increase for volatile markets.
Max Support/Resistance Zones: Limits displayed zones.
Zone Merge Distance ATR: Zones within this distance combine. Prevents duplicate zones at similar prices.
Zone Decay Rate: How quickly ignored zones fade. Default 0.997 means ~50% strength after 230 bars. Lower values mean faster decay.
Reactivation Boost: Strength multiplier when price returns to a zone. Default 1.3 (30% boost).
Detect Rejection Levels: Enables horizontal cluster detection.
Min Rejections for Level: How many aligned highs/lows needed to form a horizontal level.
Rejection Lookback Bars: How far back to scan for clusters. Lower values improve performance.
--- VOLUME INTEGRATION ---
Enable Volume Weighting: When on, volume affects touch quality and breakout significance.
High Volume Threshold: Volume ratio above this is considered significant. Default 1.5 (50% above average).
Low Volume Threshold: Volume ratio below this is considered weak. Default 0.7 (30% below average).
Volume Average Lookback: Bars used for average volume calculation.
--- DAILY LEVELS ---
Show PDH/PDL: Toggle previous day levels
Show Weekly H/L: Toggle previous week levels
Line Style: Solid, Dashed, or Dotted
--- MULTI-TIMEFRAME ---
Show HTF Levels: Toggle higher timeframe reference levels
Higher Timeframe: Select the reference timeframe
HTF Lookback Period: How many HTF bars to scan for high/low
--- LABEL SETTINGS ---
Label Mode:
- Compact: Shows type, touch count, and status (S3+)
- Minimal: Shows type only (S)
- None: Hides all labels
Hide Labels Beyond ATR Threshold: Reduces label clutter for distant levels
Max Labels to Display: Limits total labels to prevent overcrowding
--- DASHBOARD ---
Show Dashboard: Toggle the information panel
Position: Choose corner or center placement
Size: Tiny, Small, Normal, or Large text
--- THEME ---
Color Theme: Choose from Dark, Light, Neon, Classic, or Ocean presets. Each theme adjusts all colors for consistency.
--- VISUAL SETTINGS ---
Major/Minor Line Width: Thickness for significant vs standard lines
Show Breakout Markers: Toggle breakout event labels
═════════════════════════════════════════════════════════════
PRACTICAL USAGE
--- FOR TREND FOLLOWING ---
Watch for price respecting bullish trendlines in uptrends. Multiple touches with clean rejections indicate strong trend structure. A break below a well-tested trendline (4+ touches, high precision) often signals trend weakness.
--- FOR REVERSAL TRADING ---
Look for flipped zones (purple). A former resistance that now acts as support represents a genuine shift in market structure. Retested zones (orange) offer potential entry points as price confirms the level.
--- FOR BREAKOUT TRADING ---
Monitor tested zones (blue, 3+ touches). These validated levels, when broken with high volume (large BRK marker), often lead to significant moves. The R:R ratio in the dashboard helps assess if the breakout offers favorable risk-reward.
--- FOR MULTI-TIMEFRAME ANALYSIS ---
The HTF levels provide context. When an intraday support zone aligns with a daily support level (HTF S), that confluence adds significance. The dashboard shows distances to help identify these alignments.
--- FOR RISK MANAGEMENT ---
Use zone levels for stop placement. The dashboard R:R calculation shows reward-to-risk based on distance to nearest zones. Zones with higher quality scores have historically held better.
═════════════════════════════════════════════════════════════
WHAT MAKES THIS ORIGINAL
This is not a simple combination of existing indicators. The originality lies in:
1. Quality-Weighted Touch Scoring
Most trendline indicators count touches equally. This system scores each touch based on precision, reaction type, and volume, then filters by average quality. This eliminates many false positives that plague simple touch-counting approaches.
2. Zone Lifecycle State Machine
Rather than static boxes, zones evolve through states (active, tested, broken, retested, flipped) with distinct visual treatment and strength adjustments. This mirrors how experienced traders mentally track levels.
3. Decay and Reactivation System
Zones that price ignores fade naturally, while zones that price returns to strengthen. This creates a self-cleaning chart where only relevant levels remain prominent.
4. Timeframe-Adaptive Parameters
Instead of requiring different settings for each timeframe, the system automatically scales its detection parameters. The same configuration works from 1-minute to monthly charts.
5. Volume-Integrated Significance
When enabled, volume affects every calculation: touch quality, zone strength, and breakout marker prominence. High-volume events receive appropriate emphasis.
6. Synergistic Component Integration
Trendlines, zones, daily levels, and HTF reference work together. The dashboard synthesizes all components into actionable metrics like R:R ratio and market bias.
═════════════════════════════════════════════════════════════
ALERTS AVAILABLE
- Bullish Trendline Break: Triggers when price breaks below a bullish trendline
- Bearish Trendline Break: Triggers when price breaks above a bearish trendline
- Approaching Support: Triggers when price nears a support zone
- Approaching Resistance: Triggers when price nears a resistance zone
- PDH Test: Triggers when price tests previous day high
- PDL Test: Triggers when price tests previous day low
- Zone Retest: Triggers when price returns to a broken zone
- Zone Flip: Triggers when a broken zone confirms as flipped
═════════════════════════════════════════════════════════════
BACKGROUND COLOR INDICATOR
The chart background subtly changes color when price approaches key levels:
- Green tint: Price near support zone
- Red tint: Price near resistance zone
- Yellow tint: Price near both support and resistance (compression)
- No color: Price in open space between levels
This provides at-a-glance awareness without requiring constant dashboard monitoring.
═════════════════════════════════════════════════════════════
PERFORMANCE NOTES
The indicator is optimized for performance through:
- Calculation throttling for intensive operations
- Capped loop iterations to prevent script timeout
- Efficient array management
- Sampling techniques for historical scanning
If you experience slow loading on very long charts, consider reducing:
- Rejection Lookback Bars
- Max Zones settings
- Disabling Detect Rejection Levels temporarily
═════════════════════════════════════════════════════════════
NON-REPAINTING CONFIRMATION
This indicator uses confirmed bar data:
- Pivots are detected using historical lookback (not current bar)
- Zone states change only on bar close
- Trendline breaks are confirmed on bar close
- Alerts trigger only after bar confirmation
The only real-time updates occur on the current forming bar for visual purposes. All historical drawings remain fixed once their bar closes.
═════════════════════════════════════════════════════════════
DISCLAIMER
This indicator is for educational and informational purposes only. It does not constitute financial advice, investment recommendations, or trading signals.
Trading involves substantial risk of loss. Past performance of any trading system or methodology is not necessarily indicative of future results. You should not trade with money you cannot afford to lose.
The author makes no guarantees regarding the accuracy or completeness of any information provided. All trading decisions are your own responsibility.
Always conduct your own research and consider consulting with a qualified financial advisor before making any investment decisions.
═════════════════════════════════════════════════════════════
CREDITS AND ACKNOWLEDGMENTS
This indicator was developed to solve the manual charting experience, observing how price interacts with technical levels, and translating those observations into systematic rules.
Thank you to the TradingView community for the platform and Pine Script language that makes this automation possible.
═════════════════════════════════════════════════════════════
VERSION HISTORY
v1.0.0 - Initial Release
- Automatic trendline detection with quality-weighted touches
- Dynamic support/resistance zones with lifecycle management
- Volume integration for touch and breakout significance
- Multi-timeframe daily/weekly/HTF levels
- Comprehensive dashboard with real-time metrics
- Timeframe-adaptive parameter scaling
- Multiple theme options
- Complete alert system
═════════════════════════════════════════════════════════════
From Manual Drawing to Intelligent Automation
═════════════════════════════════════════════════════════════
OVERVIEW
This indicator automates years of manual chart work: detecting trendlines, forming support/resistance zones, tracking zone lifecycles, and scoring touches by quality. Instead of counting touches equally, the system weights them by precision, reaction type and volume so a high-volume wick rejection gets more influence than a low-volume consolidation.
The core philosophy is simple: not all touches are equal. A wick rejection at high volume carries more weight than a body consolidation at low volume. A zone that held three times deserves more attention than one that just formed. This indicator captures that nuanced approach through a quality-weighted touch scoring system.
═════════════════════════════════════════════════════════════
THE PROBLEM THIS SOLVES
Manual technical analysis presents several challenges:
1. Time Consumption - Drawing and updating trendlines across multiple assets and timeframes is labor-intensive
2. Subjectivity - Two traders often draw different lines on the same chart
3. Inconsistency - Fatigue leads to missed levels or inconsistent criteria
4. Delayed Updates - Manually tracking when zones break, get retested, or flip takes constant attention
This system addresses each challenge by applying consistent mathematical criteria to every potential level, updating in real-time, and tracking zone lifecycle automatically.
═════════════════════════════════════════════════════════════
HOW IT WORKS
--- TRENDLINE DETECTION ---
The system identifies trendlines through a multi-step process:
Step 1: Pivot Detection
The indicator scans for significant swing highs and swing lows using a sensitivity parameter that automatically scales based on your chart timeframe. Shorter timeframes use faster detection, while daily charts use slower, more significant pivots.
Step 2: Line Validation
For each pair of pivots, the system calculates:
- Slope direction (upward for bullish, downward for bearish)
- Current relevance (is the projected line near current price?)
- Minimum touch requirements
Step 3: Touch Quality Scoring
This is where the system differs from simple trendline indicators. Each touch is scored based on:
Precision: How close did price get to the line? A touch at the exact line scores 1.0, while a touch at the edge of tolerance scores lower.
Reaction Type: The system classifies touches into categories:
* Wick Rejection (1.0) - Wick touched but body stayed outside
* Body Rejection (0.8) - Body touched but closed with reaction
* False Break (1.2) - Price broke through then recovered (strongest signal)
* Consolidation (0.5) - Price lingered without clear rejection
Volume Weight: When volume integration is enabled, high-volume touches receive a boost (up to 1.5x), while low-volume touches are discounted (down to 0.5x).
Step 4: Display Filtering
Only trendlines meeting minimum touch count AND minimum average precision are displayed. This eliminates weak, coincidental alignments.
--- SUPPORT AND RESISTANCE ZONES ---
Zones are detected from pivot points and horizontal level clustering:
Pivot-Based Zones:
When a significant pivot forms, a zone is created around that price level. Zone height is calculated as an ATR multiple, automatically scaling with volatility.
Cluster-Based Zones:
The system scans historical bars to find where multiple highs or lows align within tolerance. These horizontal rejection clusters often mark institutional interest levels.
Zone Merging:
When two zones are within a configurable distance, they merge into one stronger zone rather than cluttering the chart.
--- ZONE LIFECYCLE MANAGEMENT ---
This is the core innovation. Zones progress through states:
ACTIVE: Newly formed zone, not yet validated
TESTED: Zone has received 3+ quality touches, proving its relevance
BROKEN: Price closed through the zone
RETESTED: Price returned to test the broken zone
FLIPPED: Former support now acts as resistance (or vice versa)
Each state is visually distinct:
- Active zones show in standard support/resistance colors
- Tested zones show in blue with thicker borders
- Broken zones fade to gray
- Retested zones show in orange
- Flipped zones show in purple
Zone Decay:
Zones that price ignores gradually lose strength. The decay rate is configurable (default 0.997 per bar). This means a zone loses roughly half its strength after 230 bars of no interaction. This prevents old, irrelevant levels from cluttering your chart.
Zone Reactivation:
If price returns to a decayed zone, it receives a strength boost, recognizing that the level remains relevant.
═════════════════════════════════════════════════════════════
READING THE VISUAL ELEMENTS
--- TRENDLINES ---
Label Format: [Type][Touches][Status]
Examples:
- B3 = Bullish trendline with 3 touches (active)
- B5x = Bullish trendline with 5 touches (broken)
- R4 = Bearish/Resistance trendline with 4 touches (active)
Line Thickness:
- Thin lines = 2-3 touches
- Thick lines = 4+ touches (higher significance)
Line Style:
- Solid = Active trendline
- Dotted = Broken trendline
--- ZONES ---
Label Format: [Type][Touches][Status]
Examples:
- S2 = Support zone with 2 touches (active)
- S4+ = Support zone with 4 touches (tested/validated)
- R3x = Resistance zone with 3 touches (broken)
- S5r = Support zone retested after break
- R4f = Resistance zone that flipped to support
Border Thickness:
- Thin border = Standard zone
- Thick border = Validated zone (3+ touches or high volume)
Zone Colors by State:
- Teal/Green shades = Support zones
- Red shades = Resistance zones
- Blue = Tested/validated zones
- Gray = Broken zones
- Orange = Retested zones
- Purple = Flipped zones
--- DAILY AND WEEKLY LEVELS ---
PDH = Previous Day High
PDL = Previous Day Low
PWH = Previous Week High
PWL = Previous Week Low
HTF R = Higher Timeframe Resistance
HTF S = Higher Timeframe Support
These levels use dashed lines by default and extend from the period open.
--- BREAKOUT MARKERS ---
When a trendline breaks, the system places a "BRK" label at the breakout point.
Marker Size (when volume integration enabled):
- Tiny = Normal volume breakout
- Small = Above-average volume breakout
- Normal = High volume breakout (1.5x+ average)
Recent breakouts show full labels; older breakouts show as dots.
═════════════════════════════════════════════════════════════
THE DASHBOARD EXPLAINED
The information panel displays real-time metrics organized in sections:
--- TRENDLINES SECTION ---
Bull TL: Count of active bullish trendlines
Bear TL: Count of active bearish trendlines
Near B: Price level of nearest bullish trendline
Near R: Price level of nearest bearish trendline
--- S/R ZONES SECTION ---
Support: Nearest support zone price
Resist: Nearest resistance zone price
Dist: Percentage distance to each zone
Touches: Touch count of nearest zones
Quality: Quality score of nearest zones (higher = stronger)
--- DAILY LEVELS SECTION ---
PDH/PDL: Previous day high and low prices
Dist: Percentage distance from current price
Green percentage = price is above the level
Red percentage = price is below the level
--- WEEKLY LEVELS SECTION ---
PWH/PWL: Previous week high and low prices
Dist: Percentage distance from current price
--- ANALYSIS SECTION ---
R:R: Risk-to-Reward ratio based on distance to nearest support (risk) and resistance (reward). Ratios of 2:1 or higher show in green.
Bias: Market direction assessment based on:
- Trendline count comparison
- Distance to support vs resistance
- Zone quality comparison
- Price position relative to 50 SMA
Sup Zones / Res Zones: Count of active zones
Flipped / Retested: Count of zones in these states
Trend: Trend strength based on moving average alignment (Strong Bull to Strong Bear)
Volatility: Current ATR relative to 50-period average (High/Normal/Low)
Vol Ratio: Current volume relative to 20-period average
Vol Wgt: Volume weighting status (ON/OFF)
═════════════════════════════════════════════════════════════
TIMEFRAME ADAPTATION
The indicator automatically adjusts its parameters based on your chart timeframe:
SCALP MODE (Under 15 minutes)
- Faster pivot detection
- Tighter zone heights
- More responsive to recent price action
- Dashboard shows [SCALP] tag
INTRADAY MODE (15 minutes to 1 hour)
- Standard parameters
- Balanced sensitivity
- Dashboard shows [INTRA] tag
SWING MODE (1 hour to 4 hours)
- Slower pivot detection
- Wider zone heights
- Focus on more significant levels
- Dashboard shows [SWING] tag
POSITION MODE (Daily and above)
- Slowest detection for major levels only
- Widest zones for higher timeframe context
- Dashboard shows [POS] tag
This means you can use the same settings across all timeframes, and the indicator adapts appropriately.
═════════════════════════════════════════════════════════════
SETTINGS GUIDE
--- TRENDLINE SETTINGS ---
Show Trendlines: Master toggle for all trendline visibility
Base Pivot Sensitivity: Controls how many bars the system looks back to identify pivots. Lower values find more pivots; higher values find only significant ones. Default 10 works well for most cases.
Minimum Touches: How many touches a trendline needs before displaying. Default 3 filters out weak lines.
Minimum Precision Score: Average touch quality required. Range 0.3 to 0.95. Default 0.6 provides good balance. Higher values show only the most precise trendlines.
Max Bullish/Bearish Trendlines: Limits how many lines display to prevent clutter.
Touch Tolerance ATR Mult: How close price must get to count as a touch, measured in ATR. Default 0.5 ATR works for most markets.
Extend Lines Right: Whether trendlines project into the future.
--- SUPPORT RESISTANCE SETTINGS ---
Show SR Zones: Master toggle for zone visibility
Base Zone Detection Length: Pivot lookback for zone creation. Similar to trendline sensitivity.
Base Zone Height ATR Mult: How tall zones are, as ATR multiple. Default 0.5 ATR. Increase for volatile markets.
Max Support/Resistance Zones: Limits displayed zones.
Zone Merge Distance ATR: Zones within this distance combine. Prevents duplicate zones at similar prices.
Zone Decay Rate: How quickly ignored zones fade. Default 0.997 means ~50% strength after 230 bars. Lower values mean faster decay.
Reactivation Boost: Strength multiplier when price returns to a zone. Default 1.3 (30% boost).
Detect Rejection Levels: Enables horizontal cluster detection.
Min Rejections for Level: How many aligned highs/lows needed to form a horizontal level.
Rejection Lookback Bars: How far back to scan for clusters. Lower values improve performance.
--- VOLUME INTEGRATION ---
Enable Volume Weighting: When on, volume affects touch quality and breakout significance.
High Volume Threshold: Volume ratio above this is considered significant. Default 1.5 (50% above average).
Low Volume Threshold: Volume ratio below this is considered weak. Default 0.7 (30% below average).
Volume Average Lookback: Bars used for average volume calculation.
--- DAILY LEVELS ---
Show PDH/PDL: Toggle previous day levels
Show Weekly H/L: Toggle previous week levels
Line Style: Solid, Dashed, or Dotted
--- MULTI-TIMEFRAME ---
Show HTF Levels: Toggle higher timeframe reference levels
Higher Timeframe: Select the reference timeframe
HTF Lookback Period: How many HTF bars to scan for high/low
--- LABEL SETTINGS ---
Label Mode:
- Compact: Shows type, touch count, and status (S3+)
- Minimal: Shows type only (S)
- None: Hides all labels
Hide Labels Beyond ATR Threshold: Reduces label clutter for distant levels
Max Labels to Display: Limits total labels to prevent overcrowding
--- DASHBOARD ---
Show Dashboard: Toggle the information panel
Position: Choose corner or center placement
Size: Tiny, Small, Normal, or Large text
--- THEME ---
Color Theme: Choose from Dark, Light, Neon, Classic, or Ocean presets. Each theme adjusts all colors for consistency.
--- VISUAL SETTINGS ---
Major/Minor Line Width: Thickness for significant vs standard lines
Show Breakout Markers: Toggle breakout event labels
═════════════════════════════════════════════════════════════
PRACTICAL USAGE
--- FOR TREND FOLLOWING ---
Watch for price respecting bullish trendlines in uptrends. Multiple touches with clean rejections indicate strong trend structure. A break below a well-tested trendline (4+ touches, high precision) often signals trend weakness.
--- FOR REVERSAL TRADING ---
Look for flipped zones (purple). A former resistance that now acts as support represents a genuine shift in market structure. Retested zones (orange) offer potential entry points as price confirms the level.
--- FOR BREAKOUT TRADING ---
Monitor tested zones (blue, 3+ touches). These validated levels, when broken with high volume (large BRK marker), often lead to significant moves. The R:R ratio in the dashboard helps assess if the breakout offers favorable risk-reward.
--- FOR MULTI-TIMEFRAME ANALYSIS ---
The HTF levels provide context. When an intraday support zone aligns with a daily support level (HTF S), that confluence adds significance. The dashboard shows distances to help identify these alignments.
--- FOR RISK MANAGEMENT ---
Use zone levels for stop placement. The dashboard R:R calculation shows reward-to-risk based on distance to nearest zones. Zones with higher quality scores have historically held better.
═════════════════════════════════════════════════════════════
WHAT MAKES THIS ORIGINAL
This is not a simple combination of existing indicators. The originality lies in:
1. Quality-Weighted Touch Scoring
Most trendline indicators count touches equally. This system scores each touch based on precision, reaction type, and volume, then filters by average quality. This eliminates many false positives that plague simple touch-counting approaches.
2. Zone Lifecycle State Machine
Rather than static boxes, zones evolve through states (active, tested, broken, retested, flipped) with distinct visual treatment and strength adjustments. This mirrors how experienced traders mentally track levels.
3. Decay and Reactivation System
Zones that price ignores fade naturally, while zones that price returns to strengthen. This creates a self-cleaning chart where only relevant levels remain prominent.
4. Timeframe-Adaptive Parameters
Instead of requiring different settings for each timeframe, the system automatically scales its detection parameters. The same configuration works from 1-minute to monthly charts.
5. Volume-Integrated Significance
When enabled, volume affects every calculation: touch quality, zone strength, and breakout marker prominence. High-volume events receive appropriate emphasis.
6. Synergistic Component Integration
Trendlines, zones, daily levels, and HTF reference work together. The dashboard synthesizes all components into actionable metrics like R:R ratio and market bias.
═════════════════════════════════════════════════════════════
ALERTS AVAILABLE
- Bullish Trendline Break: Triggers when price breaks below a bullish trendline
- Bearish Trendline Break: Triggers when price breaks above a bearish trendline
- Approaching Support: Triggers when price nears a support zone
- Approaching Resistance: Triggers when price nears a resistance zone
- PDH Test: Triggers when price tests previous day high
- PDL Test: Triggers when price tests previous day low
- Zone Retest: Triggers when price returns to a broken zone
- Zone Flip: Triggers when a broken zone confirms as flipped
═════════════════════════════════════════════════════════════
BACKGROUND COLOR INDICATOR
The chart background subtly changes color when price approaches key levels:
- Green tint: Price near support zone
- Red tint: Price near resistance zone
- Yellow tint: Price near both support and resistance (compression)
- No color: Price in open space between levels
This provides at-a-glance awareness without requiring constant dashboard monitoring.
═════════════════════════════════════════════════════════════
PERFORMANCE NOTES
The indicator is optimized for performance through:
- Calculation throttling for intensive operations
- Capped loop iterations to prevent script timeout
- Efficient array management
- Sampling techniques for historical scanning
If you experience slow loading on very long charts, consider reducing:
- Rejection Lookback Bars
- Max Zones settings
- Disabling Detect Rejection Levels temporarily
═════════════════════════════════════════════════════════════
NON-REPAINTING CONFIRMATION
This indicator uses confirmed bar data:
- Pivots are detected using historical lookback (not current bar)
- Zone states change only on bar close
- Trendline breaks are confirmed on bar close
- Alerts trigger only after bar confirmation
The only real-time updates occur on the current forming bar for visual purposes. All historical drawings remain fixed once their bar closes.
═════════════════════════════════════════════════════════════
DISCLAIMER
This indicator is for educational and informational purposes only. It does not constitute financial advice, investment recommendations, or trading signals.
Trading involves substantial risk of loss. Past performance of any trading system or methodology is not necessarily indicative of future results. You should not trade with money you cannot afford to lose.
The author makes no guarantees regarding the accuracy or completeness of any information provided. All trading decisions are your own responsibility.
Always conduct your own research and consider consulting with a qualified financial advisor before making any investment decisions.
═════════════════════════════════════════════════════════════
CREDITS AND ACKNOWLEDGMENTS
This indicator was developed to solve the manual charting experience, observing how price interacts with technical levels, and translating those observations into systematic rules.
Thank you to the TradingView community for the platform and Pine Script language that makes this automation possible.
═════════════════════════════════════════════════════════════
VERSION HISTORY
v1.0.0 - Initial Release
- Automatic trendline detection with quality-weighted touches
- Dynamic support/resistance zones with lifecycle management
- Volume integration for touch and breakout significance
- Multi-timeframe daily/weekly/HTF levels
- Comprehensive dashboard with real-time metrics
- Timeframe-adaptive parameter scaling
- Multiple theme options
- Complete alert system
═════════════════════════════════════════════════════════════
Notas de Lançamento
Updated Usage NotesNotas de Lançamento
CHANGELOG v1.1.0-----------------
ADDED:
- Trendline Convergence Alert: Triggers when 2 or more unbroken
trendlines of the same direction (both bullish or both bearish)
converge at a single point within the forward extension window
and within 3x ATR of current price.
- Trendline Intersection Alert: Triggers when an unbroken bullish
trendline and an unbroken bearish trendline cross each other
within the forward extension window and within 3x ATR of
current price. Indicates wedge or triangle decision points.
NON-REPAINTING Nature:
- Both new alerts evaluate only on barstate.isconfirmed.
- Intersection math uses fixed historical pivot anchor points.
- Forward scan is bounded by the Extension Bars setting.
- No lookahead or future bar data is referenced.
- Alerts fire once per confirmed bar and do not change retroactively.
TECHNICAL NOTES:
- Added f_findLineIntersection utility function for line cross
calculation using slope-intercept method.
- Broken trendlines are excluded from all intersection checks.
- Parallel lines (zero slope difference) return na and are skipped.
- Price proximity filter (3x ATR) prevents alerts on distant
theoretical intersections that have no trading relevance.
Notas de Lançamento
Routine maintenance update. Core logic unchanged.
Disponível em Espaço Pago
Este indicador está disponível apenas para assinantes de Ultimate Arsenal. Assine para acessar este e outros scripts de BullByte.

💎 BullByte Top Tools | Paid Space : in.tradingview.com/spaces/BullByte/
💬 Join the community: Telegram
t.me/BullByteTradingLab
⚡Follow for new indicator releases
💬 Join the community: Telegram
t.me/BullByteTradingLab
⚡Follow for new indicator releases
Aviso legal
As informações e publicações não se destinam a ser, e não constituem, conselhos ou recomendações financeiras, de investimento, comerciais ou de outro tipo fornecidos ou endossados pela TradingView. Leia mais nos Termos de Uso.
Disponível em Espaço Pago
Este indicador está disponível apenas para assinantes de Ultimate Arsenal. Assine para acessar este e outros scripts de BullByte.
💎 BullByte Top Tools | Paid Space : in.tradingview.com/spaces/BullByte/
💬 Join the community: Telegram
t.me/BullByteTradingLab
⚡Follow for new indicator releases
💬 Join the community: Telegram
t.me/BullByteTradingLab
⚡Follow for new indicator releases
Aviso legal
As informações e publicações não se destinam a ser, e não constituem, conselhos ou recomendações financeiras, de investimento, comerciais ou de outro tipo fornecidos ou endossados pela TradingView. Leia mais nos Termos de Uso.