KIRON VWAP Engine
OVERVIEW
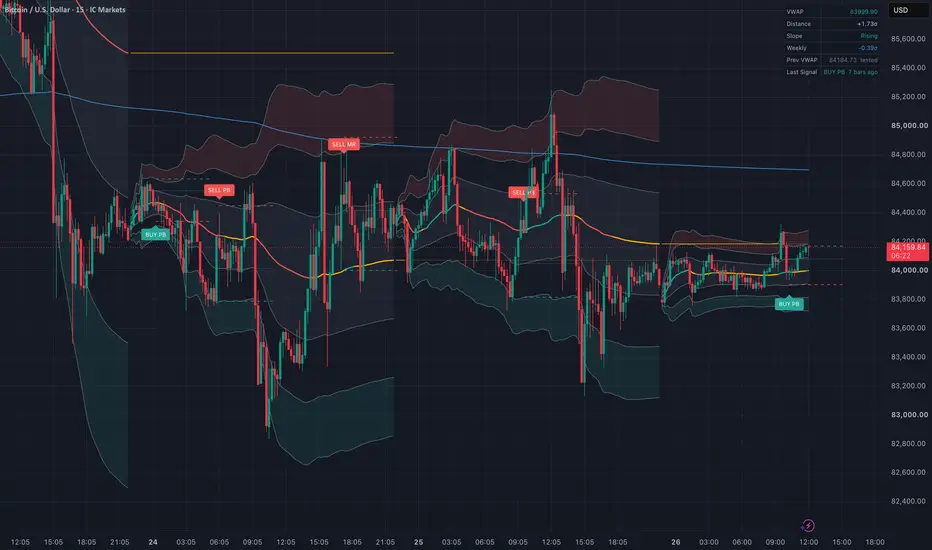
KIRON VWAP Engine is a multi-anchor Volume Weighted Average Price framework that combines a high-precision VWAP calculation, volume-weighted standard deviation bands, prior-period reference levels and a rules-based signal layer in a single overlay. It is designed for intraday traders who use VWAP as a fair-value reference and want to see trend state, stretch from value and structured setups in one place.
WHAT MAKES IT DIFFERENT
1. Intrabar Precision
Standard VWAP implementations treat each chart bar as a single price (typically HLC3). On 15-minute or hourly charts, that approximation can misplace volume within the bar. In Intrabar mode, this script rebuilds every chart bar from lower-timeframe data (1-minute by default), computing the bar's volume-weighted mean price and mean squared price from its constituent intrabars. Both the VWAP and its deviation bands are therefore calculated from finer-grained volume distribution. Where lower-timeframe history is unavailable (TradingView limits intrabar requests to roughly 100,000 bars), the script automatically falls back to chart-bar data. Select "Chart" precision to compute the full history on a uniform basis.
2. External Volume Source
Spot and CFD symbols frequently report broker tick volume rather than traded volume. The optional External Volume setting weights the chart's prices using another symbol's volume, for example applying exchange-traded futures volume to a spot chart. Bars where the external symbol has no data carry zero weight.
3. Volume-Weighted Deviation Bands
Bands are calculated from the volume-weighted variance of price around the VWAP (sigma = sqrt(sum(P^2 x V) / sum(V) - VWAP^2)), plotted at three user-defined multiples (1, 2 and 3 by default). The zone between bands 2 and 3 is shaded to highlight statistically stretched conditions.
4. Clean Anchor Handling
Nothing is plotted until the first complete anchor period begins, so partial periods at the start of chart history are never displayed. Connecting segments at each reset are hidden to avoid misleading diagonal lines.
FEATURES
Primary VWAP
Anchored to a selectable period (Daily by default). The line colour reflects slope state: rising, falling or flat. Slope is measured over a configurable lookback and normalised by ATR, so small tick-by-tick changes do not cause colour flicker.
Weekly VWAP
Higher-timeframe fair-value reference for swing context and confluence.
Previous Period VWAP
The final VWAP value of the prior period, carried forward as a horizontal reference. The level displays at full strength while untested and fades once price trades through it.
Event Anchors (intraday only)
- London Open (default 08:00 Europe/London)
- COMEX Open (default 08:20 America/New_York)
- Custom Anchor (any date and time)
Each resets on the first bar whose close passes the specified time, so the anchor works correctly on any intraday timeframe.
Information Table
- Current VWAP value
- Distance from VWAP in standard deviations
- Slope state
- Distance from Weekly VWAP in weekly standard deviations
- Previous period VWAP and whether it has been tested
- Most recent signal and bars elapsed
SIGNAL LOGIC
Signals are confirmed on bar close only and do not repaint. Each includes a suggested stop and two targets, displayed in the label tooltip and optionally drawn as lines on the chart.
Trend Pullback (PB)
Conditions for a long (shorts are the mirror image):
- VWAP slope is rising
- Price pulls back to the VWAP without breaking the second lower band
- No bar closes below the first lower band during the setup
- A bullish bar closes back above the VWAP, either with a lower rejection wick meeting the minimum size or by reclaiming the VWAP from a prior close at or below it
Stop: beyond the setup swing low plus an ATR buffer
Target 1: upper band 1
Target 2: upper band 2
Mean Reversion (MR)
Conditions for a short (longs are the mirror image):
- VWAP slope is flat
- Price tags the second upper band
- A bearish bar closes back inside band 2, either with an upper rejection wick or re-entering from a prior close outside the band
Stop: beyond the setup swing high plus an ATR buffer
Target 1: band 1, or halfway to the VWAP
Target 2: the VWAP
Mean Reversion signals are suppressed while the VWAP is trending, to avoid fading directional moves.
Signal Filters
- Warm-up period: no signals for a set number of bars after each reset
- One signal per setup: after a Pullback signal, price must close beyond band 1 before another fires in the same direction; after a Mean Reversion signal, price must return to the VWAP
- Minimum reward-to-risk to Target 2 (default 1.0)
- Optional Weekly VWAP filter: longs only above the Weekly VWAP, shorts only below
HOW TO USE
1. Apply to an intraday chart. The default settings are designed around 5-minute to 15-minute charts with a Daily anchor.
2. Read the slope colour first. A rising or falling VWAP indicates directional participation; a flat VWAP indicates balance.
3. In trending conditions, treat the VWAP and first band as the value zone for continuation entries. Price holding band 2 or 3 in a strong trend is not in itself a reversal signal.
4. In balanced conditions, bands 2 and 3 mark statistically stretched prices, with the VWAP as the reversion target.
5. Use untested prior-period VWAPs and Weekly VWAP confluence as additional reference levels.
6. Treat signals as structured setups to be evaluated alongside your own analysis, not as standalone instructions.
SETTINGS
Core: source, primary anchor, precision mode, intrabar timeframe, external volume symbol
Deviation Bands: visibility and multiplier for each band
Additional Anchors: Weekly, Previous Period, London, COMEX and Custom anchor times
Signals: setup types, warm-up bars, setup window, minimum rejection wick, Weekly filter, stop buffer, minimum R:R, level line length
Style: slope sensitivity, line width, colours, table visibility
ALERTS
- BUY Signal / SELL Signal
- VWAP Cross Up / VWAP Cross Down
- Upper Band 2 Tag / Lower Band 2 Tag
- Previous VWAP Tagged
For alert messages containing entry, stop, targets and R:R, create an alert using the "Any alert() function call" condition.
LIMITATIONS
- VWAP accuracy depends on the volume supplied by the data feed. Symbols without reliable volume will produce a less meaningful VWAP; the script stops with an error if the feed provides no volume at all.
- Intrabar precision applies only where lower-timeframe history is available.
- When using external volume, differences in trading hours between the chart symbol and the volume symbol reduce weighting during non-overlapping periods.
- Signal conditions are rule-based and do not account for news, liquidity or broader market context.
DISCLAIMER
This script is provided for educational and informational purposes only and does not constitute financial advice. Past behaviour of price relative to VWAP does not guarantee future results. Always apply your own risk management.
KIRON VWAP Engine is a multi-anchor Volume Weighted Average Price framework that combines a high-precision VWAP calculation, volume-weighted standard deviation bands, prior-period reference levels and a rules-based signal layer in a single overlay. It is designed for intraday traders who use VWAP as a fair-value reference and want to see trend state, stretch from value and structured setups in one place.
WHAT MAKES IT DIFFERENT
1. Intrabar Precision
Standard VWAP implementations treat each chart bar as a single price (typically HLC3). On 15-minute or hourly charts, that approximation can misplace volume within the bar. In Intrabar mode, this script rebuilds every chart bar from lower-timeframe data (1-minute by default), computing the bar's volume-weighted mean price and mean squared price from its constituent intrabars. Both the VWAP and its deviation bands are therefore calculated from finer-grained volume distribution. Where lower-timeframe history is unavailable (TradingView limits intrabar requests to roughly 100,000 bars), the script automatically falls back to chart-bar data. Select "Chart" precision to compute the full history on a uniform basis.
2. External Volume Source
Spot and CFD symbols frequently report broker tick volume rather than traded volume. The optional External Volume setting weights the chart's prices using another symbol's volume, for example applying exchange-traded futures volume to a spot chart. Bars where the external symbol has no data carry zero weight.
3. Volume-Weighted Deviation Bands
Bands are calculated from the volume-weighted variance of price around the VWAP (sigma = sqrt(sum(P^2 x V) / sum(V) - VWAP^2)), plotted at three user-defined multiples (1, 2 and 3 by default). The zone between bands 2 and 3 is shaded to highlight statistically stretched conditions.
4. Clean Anchor Handling
Nothing is plotted until the first complete anchor period begins, so partial periods at the start of chart history are never displayed. Connecting segments at each reset are hidden to avoid misleading diagonal lines.
FEATURES
Primary VWAP
Anchored to a selectable period (Daily by default). The line colour reflects slope state: rising, falling or flat. Slope is measured over a configurable lookback and normalised by ATR, so small tick-by-tick changes do not cause colour flicker.
Weekly VWAP
Higher-timeframe fair-value reference for swing context and confluence.
Previous Period VWAP
The final VWAP value of the prior period, carried forward as a horizontal reference. The level displays at full strength while untested and fades once price trades through it.
Event Anchors (intraday only)
- London Open (default 08:00 Europe/London)
- COMEX Open (default 08:20 America/New_York)
- Custom Anchor (any date and time)
Each resets on the first bar whose close passes the specified time, so the anchor works correctly on any intraday timeframe.
Information Table
- Current VWAP value
- Distance from VWAP in standard deviations
- Slope state
- Distance from Weekly VWAP in weekly standard deviations
- Previous period VWAP and whether it has been tested
- Most recent signal and bars elapsed
SIGNAL LOGIC
Signals are confirmed on bar close only and do not repaint. Each includes a suggested stop and two targets, displayed in the label tooltip and optionally drawn as lines on the chart.
Trend Pullback (PB)
Conditions for a long (shorts are the mirror image):
- VWAP slope is rising
- Price pulls back to the VWAP without breaking the second lower band
- No bar closes below the first lower band during the setup
- A bullish bar closes back above the VWAP, either with a lower rejection wick meeting the minimum size or by reclaiming the VWAP from a prior close at or below it
Stop: beyond the setup swing low plus an ATR buffer
Target 1: upper band 1
Target 2: upper band 2
Mean Reversion (MR)
Conditions for a short (longs are the mirror image):
- VWAP slope is flat
- Price tags the second upper band
- A bearish bar closes back inside band 2, either with an upper rejection wick or re-entering from a prior close outside the band
Stop: beyond the setup swing high plus an ATR buffer
Target 1: band 1, or halfway to the VWAP
Target 2: the VWAP
Mean Reversion signals are suppressed while the VWAP is trending, to avoid fading directional moves.
Signal Filters
- Warm-up period: no signals for a set number of bars after each reset
- One signal per setup: after a Pullback signal, price must close beyond band 1 before another fires in the same direction; after a Mean Reversion signal, price must return to the VWAP
- Minimum reward-to-risk to Target 2 (default 1.0)
- Optional Weekly VWAP filter: longs only above the Weekly VWAP, shorts only below
HOW TO USE
1. Apply to an intraday chart. The default settings are designed around 5-minute to 15-minute charts with a Daily anchor.
2. Read the slope colour first. A rising or falling VWAP indicates directional participation; a flat VWAP indicates balance.
3. In trending conditions, treat the VWAP and first band as the value zone for continuation entries. Price holding band 2 or 3 in a strong trend is not in itself a reversal signal.
4. In balanced conditions, bands 2 and 3 mark statistically stretched prices, with the VWAP as the reversion target.
5. Use untested prior-period VWAPs and Weekly VWAP confluence as additional reference levels.
6. Treat signals as structured setups to be evaluated alongside your own analysis, not as standalone instructions.
SETTINGS
Core: source, primary anchor, precision mode, intrabar timeframe, external volume symbol
Deviation Bands: visibility and multiplier for each band
Additional Anchors: Weekly, Previous Period, London, COMEX and Custom anchor times
Signals: setup types, warm-up bars, setup window, minimum rejection wick, Weekly filter, stop buffer, minimum R:R, level line length
Style: slope sensitivity, line width, colours, table visibility
ALERTS
- BUY Signal / SELL Signal
- VWAP Cross Up / VWAP Cross Down
- Upper Band 2 Tag / Lower Band 2 Tag
- Previous VWAP Tagged
For alert messages containing entry, stop, targets and R:R, create an alert using the "Any alert() function call" condition.
LIMITATIONS
- VWAP accuracy depends on the volume supplied by the data feed. Symbols without reliable volume will produce a less meaningful VWAP; the script stops with an error if the feed provides no volume at all.
- Intrabar precision applies only where lower-timeframe history is available.
- When using external volume, differences in trading hours between the chart symbol and the volume symbol reduce weighting during non-overlapping periods.
- Signal conditions are rule-based and do not account for news, liquidity or broader market context.
DISCLAIMER
This script is provided for educational and informational purposes only and does not constitute financial advice. Past behaviour of price relative to VWAP does not guarantee future results. Always apply your own risk management.

Aviso legal
As informações e publicações não se destinam a ser, e não constituem, conselhos ou recomendações financeiras, de investimento, comerciais ou de outro tipo fornecidos ou endossados pela TradingView. Leia mais nos Termos de Uso.
Aviso legal
As informações e publicações não se destinam a ser, e não constituem, conselhos ou recomendações financeiras, de investimento, comerciais ou de outro tipo fornecidos ou endossados pela TradingView. Leia mais nos Termos de Uso.