RSI Divergence - Follow-Through Statistics [Dots3Red]
🔍 RSI DIVERGENCE - FOLLOW-THROUGH STATISTICS [Dots3Red]
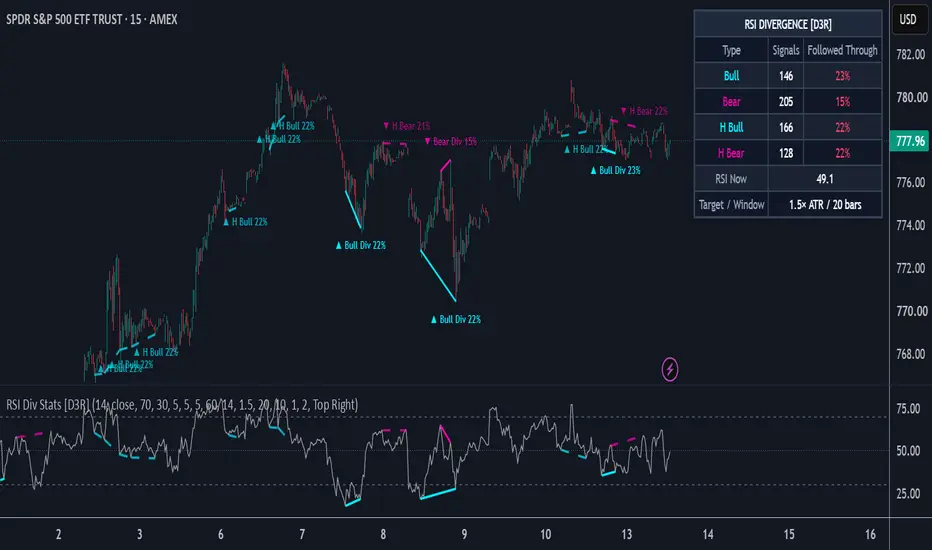
This indicator detects regular (and optionally hidden) RSI divergences using confirmed pivots, and measures how often each type of divergence was followed by a meaningful move in its direction on the current chart, shown as a percentage with the sample size next to it.
✨ WHY THIS MATTERS
RSI divergence is one of the most searched setups on TradingView, and plenty of tools draw it. Very few say how often a divergence actually led anywhere. On some instruments bullish divergences at lows work well; on others they fail again and again while price keeps grinding lower. This script keeps a running scoreboard per divergence type, so you can see what divergence has been worth on the chart in front of you.
⚙️ HOW IT WORKS
📐 Pivot-confirmed divergences — RSI swing lows and highs are found with a left/right pivot lookback. Two consecutive pivots within a configurable distance are compared with price at the same bars:
• Bullish: price lower low, RSI higher low
• Bearish: price higher high, RSI lower high
• Hidden bullish (optional): price higher low, RSI lower low
• Hidden bearish (optional): price lower high, RSI higher high
🎯 Follow-through grading — from the close of the bar where the divergence is confirmed, each divergence is graded against two levels frozen at that moment:
• Followed through — price moves a set ATR distance in the divergence direction
• Failed — price breaks the pivot that formed the divergence first, or the resolve window runs out
If both happen on the same bar, it counts as failed. If price is already past the pivot at confirmation, it is counted as an immediate failure rather than skipped.
🔒 Non-repainting — a pivot is only known after the right-side lookback has passed, so every divergence appears that many bars after its second pivot. Once drawn, it never moves or disappears. This delay is the honest cost of confirmation.
📈 Drawn where you look — divergence lines on the RSI pane and on the price chart, with labels on the price chart showing the type's measured rate. Hidden divergences are drawn dashed.
🖥️ Dashboard on the price chart — signals and follow-through rate per type, current RSI, and the grading target and window.
🧭 HOW TO USE
1️⃣ Check the rate before trusting a divergence. A bullish divergence on a chart where bullish divergences have followed through 60% of the time is very different from one where it's 35%.
2️⃣ Let each type collect enough samples. Divergences are not frequent, so give the dashboard time, or use a longer chart history.
3️⃣ Tune the target to how you trade. A larger ATR target asks more of each divergence and usually lowers the rate. Set it close to the move you would actually aim for.
4️⃣ Remember the confirmation delay. With a right lookback of 5, the divergence appears 5 bars after the turn. Shorter lookbacks react faster but find noisier pivots.
5️⃣ Use it as one piece of context. The rates describe how divergence has behaved on this chart. They do not predict the next one.
⏱️ WHICH TIMEFRAMES WORK BEST
15-minute through 4-hour gives the best balance between enough divergences to build a sample and pivots that reflect real swings. Daily works on instruments with long history.
🛠️ SETTINGS
📐 RSI — length, source, overbought and oversold levels
🔍 Divergence Detection — pivot lookback left/right, min and max bars between pivots, include hidden divergences
🎯 Follow-Through Grading — ATR length, follow-through target (× ATR), max bars to resolve, minimum samples to show a rate
🎨 Visuals — RSI line color and thickness, level line color, bullish and bearish colors, divergence line thickness, lines on RSI, lines on price, labels on price
🖥️ Dashboard — show/hide, position
🔔 Alerts — bullish, bearish, hidden bullish and hidden bearish divergence confirmed
📝 NOTES
All rates are specific to this chart, timeframe and settings, and do not transfer to other instruments or configurations. Alerts fire on confirmed bars; setting them to "Once Per Bar Close" matches how the script detects divergences.
⚠️ DISCLAIMER
This is an analytical and visualization tool. It does not generate trade signals and does not constitute financial advice. Historical statistics do not guarantee future performance.
This indicator detects regular (and optionally hidden) RSI divergences using confirmed pivots, and measures how often each type of divergence was followed by a meaningful move in its direction on the current chart, shown as a percentage with the sample size next to it.
✨ WHY THIS MATTERS
RSI divergence is one of the most searched setups on TradingView, and plenty of tools draw it. Very few say how often a divergence actually led anywhere. On some instruments bullish divergences at lows work well; on others they fail again and again while price keeps grinding lower. This script keeps a running scoreboard per divergence type, so you can see what divergence has been worth on the chart in front of you.
⚙️ HOW IT WORKS
📐 Pivot-confirmed divergences — RSI swing lows and highs are found with a left/right pivot lookback. Two consecutive pivots within a configurable distance are compared with price at the same bars:
• Bullish: price lower low, RSI higher low
• Bearish: price higher high, RSI lower high
• Hidden bullish (optional): price higher low, RSI lower low
• Hidden bearish (optional): price lower high, RSI higher high
🎯 Follow-through grading — from the close of the bar where the divergence is confirmed, each divergence is graded against two levels frozen at that moment:
• Followed through — price moves a set ATR distance in the divergence direction
• Failed — price breaks the pivot that formed the divergence first, or the resolve window runs out
If both happen on the same bar, it counts as failed. If price is already past the pivot at confirmation, it is counted as an immediate failure rather than skipped.
🔒 Non-repainting — a pivot is only known after the right-side lookback has passed, so every divergence appears that many bars after its second pivot. Once drawn, it never moves or disappears. This delay is the honest cost of confirmation.
📈 Drawn where you look — divergence lines on the RSI pane and on the price chart, with labels on the price chart showing the type's measured rate. Hidden divergences are drawn dashed.
🖥️ Dashboard on the price chart — signals and follow-through rate per type, current RSI, and the grading target and window.
🧭 HOW TO USE
1️⃣ Check the rate before trusting a divergence. A bullish divergence on a chart where bullish divergences have followed through 60% of the time is very different from one where it's 35%.
2️⃣ Let each type collect enough samples. Divergences are not frequent, so give the dashboard time, or use a longer chart history.
3️⃣ Tune the target to how you trade. A larger ATR target asks more of each divergence and usually lowers the rate. Set it close to the move you would actually aim for.
4️⃣ Remember the confirmation delay. With a right lookback of 5, the divergence appears 5 bars after the turn. Shorter lookbacks react faster but find noisier pivots.
5️⃣ Use it as one piece of context. The rates describe how divergence has behaved on this chart. They do not predict the next one.
⏱️ WHICH TIMEFRAMES WORK BEST
15-minute through 4-hour gives the best balance between enough divergences to build a sample and pivots that reflect real swings. Daily works on instruments with long history.
🛠️ SETTINGS
📐 RSI — length, source, overbought and oversold levels
🔍 Divergence Detection — pivot lookback left/right, min and max bars between pivots, include hidden divergences
🎯 Follow-Through Grading — ATR length, follow-through target (× ATR), max bars to resolve, minimum samples to show a rate
🎨 Visuals — RSI line color and thickness, level line color, bullish and bearish colors, divergence line thickness, lines on RSI, lines on price, labels on price
🖥️ Dashboard — show/hide, position
🔔 Alerts — bullish, bearish, hidden bullish and hidden bearish divergence confirmed
📝 NOTES
All rates are specific to this chart, timeframe and settings, and do not transfer to other instruments or configurations. Alerts fire on confirmed bars; setting them to "Once Per Bar Close" matches how the script detects divergences.
⚠️ DISCLAIMER
This is an analytical and visualization tool. It does not generate trade signals and does not constitute financial advice. Historical statistics do not guarantee future performance.

Connect the dots to elevate your trading.
Aviso legal
As informações e publicações não se destinam a ser, e não constituem, conselhos ou recomendações financeiras, de investimento, comerciais ou de outro tipo fornecidos ou endossados pela TradingView. Leia mais nos Termos de Uso.
Connect the dots to elevate your trading.
Aviso legal
As informações e publicações não se destinam a ser, e não constituem, conselhos ou recomendações financeiras, de investimento, comerciais ou de outro tipo fornecidos ou endossados pela TradingView. Leia mais nos Termos de Uso.