OPEN-SOURCE SCRIPT
Advanced First + Red + 12:45 Breakout Indicator
Here's a description you can use when publishing this indicator on TradingView:
---
**Advanced First Red + 12:45 Breakout Indicator**
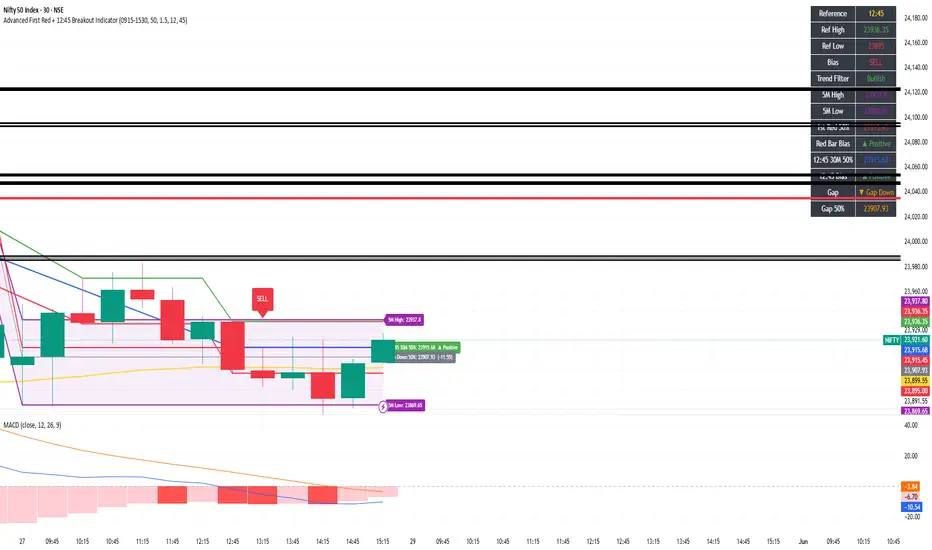
This multi-timeframe intraday indicator is built for NSE/BSE traders and combines several powerful confluence levels into a single overlay, helping you identify bias, breakout opportunities, and key institutional price zones — all visible consistently across any chart timeframe.
---
**What this indicator does:**
**🟣 First 5-Min Candle Zone (Purple Cloud)**
Marks the high and low of the opening 9:15 AM candle on the 5-minute timeframe as purple horizontal lines with a shaded cloud between them. When price is trapped inside this zone, the market is range-bound. A breakout above or below signals the start of a directional move.
**🔴 First Red Bar 50% Level (Red Line)**
Identifies the first red (bearish) candle of the day on the 5-minute timeframe and marks its 50% midpoint with a solid red horizontal line. Price above this line = positive/bullish bias. Price below = negative/bearish bias. Resets every trading day.
**🔵 12:45 PM Candle 50% Level (Blue Line)**
Fetches the 12:45 PM candle from the 30-minute timeframe and marks its midpoint with a solid blue line. This level acts as a mid-session bias filter — useful for afternoon trades. Shows "Pending" until 12:45 PM is reached.
**⚫ Gap 50% Level (Grey Line)**
Calculates the gap between yesterday's close and today's open, and marks the exact 50% retracement of that gap with a solid grey line. Colour-coded — lime for gap up, orange for gap down. A key magnet level that price frequently revisits during the session.
**🟢🔴 First Red / 12:45 Breakout Strategy**
The core breakout engine captures either the first red candle of the day or the 12:45 PM candle (configurable) as reference levels. Buy signals trigger when price crosses above the reference high with bullish EMA confirmation. Sell signals trigger on a cross below the reference low with bearish confirmation. Entry, stoploss, and target levels are plotted automatically based on your chosen Risk:Reward ratio.
**📊 Dashboard (Top Right)**
A clean real-time table displays all key levels and bias readings in one place: Reference candle, Ref High/Low, Strategy Bias, EMA Trend Filter, 5M High/Low, 1st Red 50% bias, 12:45 30M 50% bias, Gap direction, and Gap 50% level.
---
**Key Features:**
- All levels fetched via `request.security()` — fully timeframe-independent, visible on 1-min, 3-min, 5-min, 15-min, and higher charts
- Optional EMA trend filter (default 50 EMA) to avoid counter-trend trades
- Toggle each feature on/off independently via inputs
- Right-edge labels on every level showing price and current bias
- 10 built-in alert conditions covering breakouts, bias flips, and gap fills
- Works on any NSE/BSE instrument — index, futures, or stocks
---
**Recommended Timeframes:** 1-min, 3-min, 5-min, 15-min
**Best used with:** Nifty 50, Bank Nifty, Sensex, or liquid large-cap stocks during Indian market hours (9:15 AM – 3:30 PM IST)
---
*Code generated using PineGPT — marketcalls.in*
*© algostudio — Published under Mozilla Public License 2.0*
---
**Advanced First Red + 12:45 Breakout Indicator**
This multi-timeframe intraday indicator is built for NSE/BSE traders and combines several powerful confluence levels into a single overlay, helping you identify bias, breakout opportunities, and key institutional price zones — all visible consistently across any chart timeframe.
---
**What this indicator does:**
**🟣 First 5-Min Candle Zone (Purple Cloud)**
Marks the high and low of the opening 9:15 AM candle on the 5-minute timeframe as purple horizontal lines with a shaded cloud between them. When price is trapped inside this zone, the market is range-bound. A breakout above or below signals the start of a directional move.
**🔴 First Red Bar 50% Level (Red Line)**
Identifies the first red (bearish) candle of the day on the 5-minute timeframe and marks its 50% midpoint with a solid red horizontal line. Price above this line = positive/bullish bias. Price below = negative/bearish bias. Resets every trading day.
**🔵 12:45 PM Candle 50% Level (Blue Line)**
Fetches the 12:45 PM candle from the 30-minute timeframe and marks its midpoint with a solid blue line. This level acts as a mid-session bias filter — useful for afternoon trades. Shows "Pending" until 12:45 PM is reached.
**⚫ Gap 50% Level (Grey Line)**
Calculates the gap between yesterday's close and today's open, and marks the exact 50% retracement of that gap with a solid grey line. Colour-coded — lime for gap up, orange for gap down. A key magnet level that price frequently revisits during the session.
**🟢🔴 First Red / 12:45 Breakout Strategy**
The core breakout engine captures either the first red candle of the day or the 12:45 PM candle (configurable) as reference levels. Buy signals trigger when price crosses above the reference high with bullish EMA confirmation. Sell signals trigger on a cross below the reference low with bearish confirmation. Entry, stoploss, and target levels are plotted automatically based on your chosen Risk:Reward ratio.
**📊 Dashboard (Top Right)**
A clean real-time table displays all key levels and bias readings in one place: Reference candle, Ref High/Low, Strategy Bias, EMA Trend Filter, 5M High/Low, 1st Red 50% bias, 12:45 30M 50% bias, Gap direction, and Gap 50% level.
---
**Key Features:**
- All levels fetched via `request.security()` — fully timeframe-independent, visible on 1-min, 3-min, 5-min, 15-min, and higher charts
- Optional EMA trend filter (default 50 EMA) to avoid counter-trend trades
- Toggle each feature on/off independently via inputs
- Right-edge labels on every level showing price and current bias
- 10 built-in alert conditions covering breakouts, bias flips, and gap fills
- Works on any NSE/BSE instrument — index, futures, or stocks
---
**Recommended Timeframes:** 1-min, 3-min, 5-min, 15-min
**Best used with:** Nifty 50, Bank Nifty, Sensex, or liquid large-cap stocks during Indian market hours (9:15 AM – 3:30 PM IST)
---
*Code generated using PineGPT — marketcalls.in*
*© algostudio — Published under Mozilla Public License 2.0*
Script de código aberto
Em verdadeiro espírito do TradingView, o criador deste script o tornou de código aberto, para que os traders possam revisar e verificar sua funcionalidade. Parabéns ao autor! Embora você possa usá-lo gratuitamente, lembre-se de que a republicação do código está sujeita às nossas Regras da Casa.

Aviso legal
As informações e publicações não se destinam a ser, e não constituem, conselhos ou recomendações financeiras, de investimento, comerciais ou de outro tipo fornecidos ou endossados pela TradingView. Leia mais nos Termos de Uso.
Script de código aberto
Em verdadeiro espírito do TradingView, o criador deste script o tornou de código aberto, para que os traders possam revisar e verificar sua funcionalidade. Parabéns ao autor! Embora você possa usá-lo gratuitamente, lembre-se de que a republicação do código está sujeita às nossas Regras da Casa.
Aviso legal
As informações e publicações não se destinam a ser, e não constituem, conselhos ou recomendações financeiras, de investimento, comerciais ou de outro tipo fornecidos ou endossados pela TradingView. Leia mais nos Termos de Uso.