Market Structure Dashboard by @skyderfx
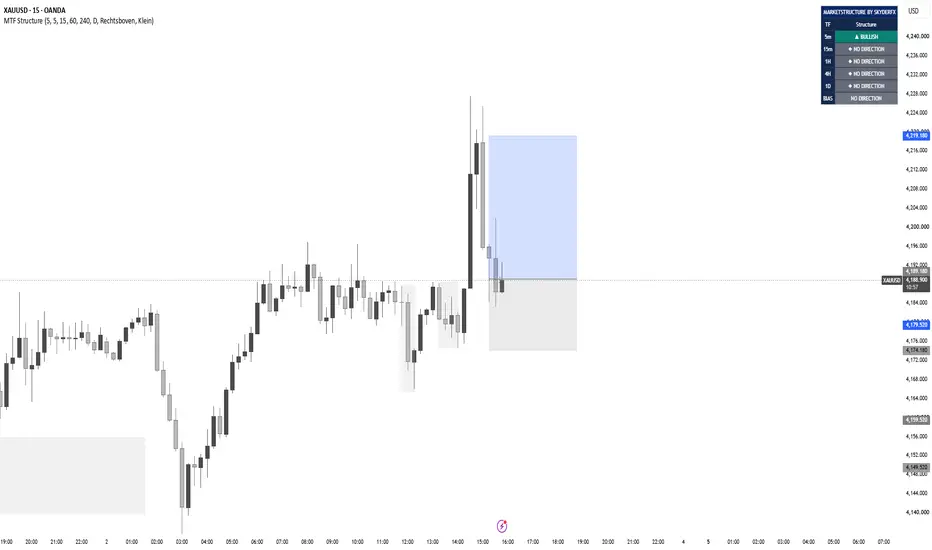
Get a clear overview of the current market structure at a glance with the Market Structure Indicator.
This tool analyzes multiple timeframes and clearly shows whether the market is in a Bullish, Bearish, or No Direction structure on each timeframe. This allows you to quickly understand how the market is behaving across different levels.
What you get:
📊 Multi-timeframe market structure
🟢 Bullish structure
🔴 Bearish structure
⚪ No Direction / Neutral structure
🎯 Clear overall bias
⏱️ Multiple timeframes displayed in one dashboard
⚡ Fast and clean overview without unnecessary information
Example of the dashboard:
1M → Bullish
5M → Bullish
15M → Bullish
1H → No Direction
4H → No Direction
1D → No Direction
BIAS → Bullish
The indicator is designed to help traders interpret market structure and multi-timeframe context more efficiently before analyzing a trade.
Disclaimer: This indicator is an analysis tool and does not constitute financial advice. Always use your own strategy, risk management, and market analysis.
This tool analyzes multiple timeframes and clearly shows whether the market is in a Bullish, Bearish, or No Direction structure on each timeframe. This allows you to quickly understand how the market is behaving across different levels.
What you get:
📊 Multi-timeframe market structure
🟢 Bullish structure
🔴 Bearish structure
⚪ No Direction / Neutral structure
🎯 Clear overall bias
⏱️ Multiple timeframes displayed in one dashboard
⚡ Fast and clean overview without unnecessary information
Example of the dashboard:
1M → Bullish
5M → Bullish
15M → Bullish
1H → No Direction
4H → No Direction
1D → No Direction
BIAS → Bullish
The indicator is designed to help traders interpret market structure and multi-timeframe context more efficiently before analyzing a trade.
Disclaimer: This indicator is an analysis tool and does not constitute financial advice. Always use your own strategy, risk management, and market analysis.

Aviso legal
As informações e publicações não se destinam a ser, e não constituem, conselhos ou recomendações financeiras, de investimento, comerciais ou de outro tipo fornecidos ou endossados pela TradingView. Leia mais nos Termos de Uso.
Aviso legal
As informações e publicações não se destinam a ser, e não constituem, conselhos ou recomendações financeiras, de investimento, comerciais ou de outro tipo fornecidos ou endossados pela TradingView. Leia mais nos Termos de Uso.