YURI Pullback Ledger Engine
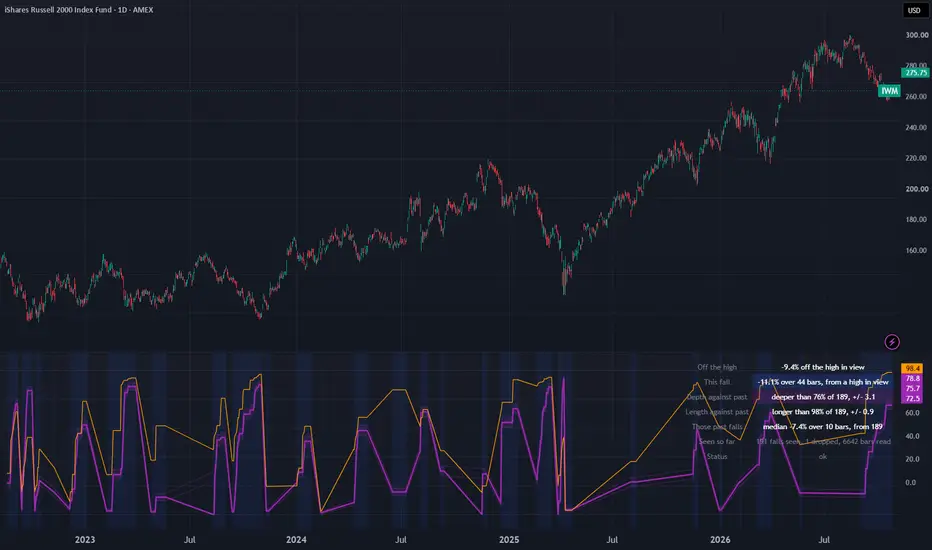
This engine tracks each decline on the chart, measuring from the peak where it began down to the lowest close it reached. Trends, market regimes, and the recoveries that follow are not part of it.
HOW TO USE IT
Apply it to a chart of one day a bar or longer. Having enough history matters more than any setting here, because the ledger is only as deep as the loaded chart. Twenty six years of a small cap index fund's daily bars gave about 190 finished declines at the default setting; three years of bars gives about twenty, which is only just what the ledger wants before it reads.
Most of the time, no decline is running. The status line says so, gives the current distance off the last peak, and leaves the pane empty. That is the normal state, not a fault.
When the close sits 4 percent under the last peak, at the default, a decline opens: the pane tints, and two lines start plotting. Read "Depth against past" first: it shows that the running decline is already deeper than that share of finished declines on this chart, with the size of the list and the error beside it. "Length against past" says the same about how many bars it took to reach its low so far. Both are floors. A decline that is still running can get deeper and longer, so either figure can rise from here, and neither comes back down while the decline is open.
"Those past falls" gives the median finished decline, which is the plain yardstick to hold today's against. "Seen so far" says how many declines the chart produced, and whether the ledger's ceiling has pushed any old ones out.
"A fall is a drop of" sets what counts as a decline. A smaller figure gives more and shallower declines to compare against; a larger one gives fewer and deeper ones. WHAT HAPPENS WHEN YOU MOVE THE THRESHOLD has the measured effect.
Once price has moved on, the chart no longer shows two facts about a finished decline: how far it fell and how many bars it took to get there. This file keeps both, for every decline contained in the history the chart has loaded, and then reads whatever decline is running right now against those two accumulated lists.
The readout answers a narrower question than whether price is low: of all the declines this instrument has produced, how many were at or shallower than the one happening now, and how many reached their floor at least as fast.
HOW A DECLINE IS DELIMITED
One number does both jobs. A decline is declared open once the close sits that percentage under the running peak, and it is declared finished once the close climbs that same percentage back above the weakest close the decline produced. Using one threshold for both edges keeps the definition symmetric, so a decline opens and closes by the same rule.
After a decline finishes, the starting point for the next one is the strongest close recorded since that floor, rather than whichever bar happened to trip the recovery threshold. Without that, the engine would finish a decline and immediately start another from a lower point, filling the lists with fragments.
Two numbers are then appended: the drop, as a percentage from peak close to floor close, and the gap, in bars, between those two points. What price did after the decline ended is not recorded anywhere, and no part of this file looks at it.
Measured on a 24796 bar daily history of the S&P 500 index running from 1927-12-30 to 2026-09-18, with the threshold at its default of four percent, 488 declines begin and finish. The typical one drops 7.3 percent and takes 14 bars to bottom out. A percentile is printed on 7520 of those bars, roughly thirty percent of the chart.
WHY BOTH DROP AND DURATION ARE KEPT
Showing both drop and duration only makes sense if they carry different information. This was tested three ways before either was plotted.
Rank correlation first. Over the 487 ledgered declines the two rank together at +0.33. Over the 7520 bars where both percentiles print, they rank together at +0.41. The threshold at which one of them would have been deleted was fixed at 0.8 before any of this was measured. Five further instruments give +0.36, +0.34, +0.31, +0.45 and +0.47 on the same test, so the result is not specific to one history.
Rank correlation alone is not enough. Two quantities can be locked together by an exact formula and still rank near zero if the formula folds (for example, something shaped like the absolute value of twice x minus a hundred). A rank test misses that. So the pair was also tested algebraically: four candidate formulas were tried, and the closest of them still fails to reproduce one percentile from the other by 94 points somewhere on the history.
The third test assumes no particular shape. Sort the bars into twenty groups by one percentile and measure how much the other still varies inside each group. If one determined the other, that variation would collapse. It does not: roughly ninety percent of the spread remains, in both directions.
A test like that needs a reference case, so the same measurement was run on a pair that genuinely is near-identical: a percentile against the raw number underneath it. There, only eighteen percent survives. The method tells the two cases apart, so the ninety percent can be read as real.
In practice, a six percent decline that took three bars and a six percent decline that took forty produce the same number on a price chart and land in two very different places here.
WHAT THE PERCENTILE ADDS
A percentile is a relabelling. Against the raw figure beneath it, the drop percentile ranks at +0.99 and the duration percentile at +0.96, which is close to identity: nothing is reordered here. What the percentile adds is the reference list.
The percentiles also do not restate the comparison the chart already gives you, how far price sits below its highest close. Against that, they come out at -0.24 and -0.06, and the group-variation test above leaves ninety and ninety-seven percent of their spread intact.
A SPLIT THAT DID NOT HOLD UP
Every decline begins at a peak, and that peak either was or was not the highest close the chart had seen up to then. That sorts the ledger in two with no parameter to choose, and the split looked promising at first.
On the S&P history, the split looks substantial. The 103 declines starting from a high-water peak drop 6.2 percent over 16 bars at the median; the 384 starting from a lower peak drop 7.7 percent over 13. Mann-Whitney returns 4.4e-05 on drop and 0.008 on duration.
Almost all of that difference comes from volatility. A threshold expressed in percent takes longer to trip when daily moves are small, and declines beginning from a high-water peak occur in quieter conditions: 14.4 percent annualised against 17.4, p equal to 0.0002. Divide the declines into three volatility bands and the duration difference disappears inside every one of them, the most extreme p being 0.28. The drop difference falls to a smallest p of 0.021, which fails a correction for three simultaneous tests, so something may remain there but nothing has been established.
Because the mechanism is volatility, the two gaps should run in opposite directions: quieter conditions mean a slower trip to the floor. They do, on all five instruments where the volatility difference is at least one point, gold included. Gold is the instrument whose volatility ordering is inverted (high-water declines being the noisier ones there), and it is correspondingly the instrument where they reach their floor sooner rather than later. A sixth instrument has a volatility difference of only 0.9 points and a duration difference of exactly zero bars, so it neither confirms nor contradicts anything, and no claim is made about it.
The ledger is consequently not divided by this label, and every percentile is read against the complete set of finished declines. The label is still displayed for the decline in progress, because which kind of peak a decline started from is a plain observation. Showing it does not mean the ledger is split by it.
THE SAMPLE, AND HOW WRONG IT COULD BE
The very first decline to finish does not enter the ledger. Its peak is simply the highest close since whatever bar the chart begins on, with no confirmed floor preceding it, so if the loaded history opens partway into a decline that peak is an artefact of the start date. Exactly one per chart is discarded; on the S&P history it measured 4.6 percent. Both the discard and the running total appear in the readout.
A percentile drawn from twenty observations is a far weaker claim than one drawn from five hundred, so the count is printed beside every percentile along with a binomial standard error in percentile points beside that, with a one-error band shaded around the drop line. Near the middle of the distribution, that error runs 11.2 points at twenty observations and 2.3 points at the 487 the S&P history supplies; out at the ninetieth percentile, 6.7 points and 1.4. Until the minimum count is reached, nothing is printed at all and the status line reports the shortfall.
That standard error is a lower limit, not the real uncertainty. It treats the declines as independent draws, which they are not, since they arrive in clusters and a few stretches of history contribute a disproportionate share.
There is also a ceiling on the list. When it engages, the count of discarded entries appears in the readout itself and not only in the data panel, because a ceiling nobody is told about would be worse than none. At the default threshold, it does not engage on any history tested here. Tighten the threshold and it does: at three percent the same index finishes 694 declines and the oldest 193 are evicted, leaving a list describing recent history rather than all of it; at two percent, 612 are evicted.
WHAT HAPPENS WHEN YOU MOVE THE THRESHOLD
This is the only setting with real consequences. On the S&P history, and quoting the medians of the list actually retained rather than of everything that finished (since above two of these settings they are not the same set):
At two percent, 1113 declines finish, 612 are evicted, and the 500 retained run 4.0 percent over 6 bars. At three percent, 694 finish, 193 are evicted, and the 500 retained run 5.6 percent over 11 bars; across all 694 the figures would be 5.8 percent and 9 bars, which is why the distinction is drawn rather than glossed over. At four percent, 488 finish and 487 are retained at 7.3 percent over 14 bars. At five percent, 339 finish and 338 are retained at 8.9 percent over 17. At eight percent, 151 finish and 150 are retained at 13.9 percent over 35 bars.
A tighter threshold splits one long slide into several declines; a looser one merges separate slides into one. Neither setting is correct in general.
Four percent is the default for one stated reason: sweeping the threshold in steps of a tenth, it is the tightest value at which the list ceiling stays out of the way on the longest history tested. Every value from 3.0 to 3.9 evicts something, from 193 entries down to 10, and 4.0 evicts nothing. That criterion is deliberately blind to any result the file produces, touching no correlation, no p value and no median. It is also relative to the ceiling setting rather than a property of markets: raise the ceiling and a tighter default would qualify, lower it and a looser one would.
WHEN THE NUMBERS MOVE AND WHEN THEY STOP
Only closes matter here, and only from bars that have finished. The live bar's contribution shifts while that bar is still trading and becomes final when it closes; once a bar is behind you, its printed values are not revised. That was verified by recomputing the entire series on charts cut short at seven different bars and comparing 30 output series and table cells against the corresponding bars of the uncut run. Two of those cuts land deliberately on awkward bars (the one where a decline is confirmed and the one at its floor) rather than on quiet stretches. All seven agree exactly. One cut leaves only 22 entries in the list against the full 487, so the comparison covers a thinly-supplied reading and not merely the arithmetic.
Within a single decline, both quantities only increase. The weakest close can fall further but cannot recover, and the bar carrying it can only move later. A percentile printed mid-decline is therefore a floor on the final one: it climbs, it does not retreat, and once the weakest close stops making new lows it holds steady while the recovery plays out. A decline sitting mid-table today will not necessarily finish there. On the S&P history, 374 of the 488 declines spent more than one bar recovering with their figures already frozen.
Nothing outside the chart's own symbol is requested, and no windowed statistic is computed anywhere. There is no second trading calendar that could drift out of alignment and no warm-up governed by another instrument's holidays.
CHARTS THIS REFUSES
Synthetic-price charts are rejected ahead of everything else and by name. On Heikin Ashi, Renko, Kagi, Line Break, Point and Figure and Range charts, the close is a manufactured figure rather than something that changed hands. The danger is that nothing would look wrong: every other condition would be satisfied, the status line would report normally, and the list would accumulate drops and durations belonging to price action that did not occur. Heikin Ashi is the worst case, since its close is an average and averages suppress exactly the extremes this file is counting.
A bar has to represent a full session or more. Because everything here is expressed in bars rather than calendar days, charts of two, three or five days per bar are consistent and are accepted: such a chart compares bars against a list assembled from bars of identical size. Intraday, tick and seconds charts are rejected explicitly, though the status line groups all three under one message, since on those the running peak becomes an intraday print and the lists turn into a record of intraday wiggles. That is a choice about what this file is for; the arithmetic itself would still run.
A bar whose close is missing or not positive is passed over individually rather than condemning the whole chart, because a percentage drop from such a value has no meaning. How many were passed over is reported in the data panel.
Under any rejection, all 19 plotted series go empty, the shaded band and the background tint vanish, all six value cells collapse to a dash, the row captions remain, and the status line does the only talking. The three horizontal guides at 0, 50 and 100 also remain, since they are fixed constants carrying no measurement.
Six status messages exist altogether: the synthetic-chart rejection, the sub-session rejection, the unusable-close rejection, no decline currently running, list still filling, and normal operation.
THE CHART'S HISTORY MATTERS MORE THAN THE SETTINGS
Each decline's peak is the strongest close since the previous floor, and the high-water label compares that peak against the strongest close the chart has loaded. Begin a chart partway into a decline and the engine starts out assuming price is at a summit.
The size of that effect is measurable. Across the complete S&P history, 21.1 percent of retained declines carry the high-water label. Start the identical index at the March 2009 low, 4410 bars, and it becomes 46.3 percent, because on that chart the running high is not the real one. Neither figure is mistaken; they answer questions about different quantities of history, and the readout reports the declines counted and bars read so the discrepancy is visible rather than guessed at.
List size behaves the same way. At the default, the full S&P history yields 487 retained declines, the Nasdaq Composite 305, a broad-market ETF starting 1993 yields 172, a Nasdaq-tracking ETF from 1999 yields 218, a small-cap ETF from 2000 yields 190, and a gold ETF from 2004 yields 109. Short history means a short list, a wide error band, and below the minimum no reading whatsoever. The fix is more history, not a smaller minimum.
WHAT IS ON SCREEN
The pane holds two series scaled nought to a hundred. Heavy purple is the running decline's drop expressed as a percentile of finished ones, wrapped in its shaded error band. Thin orange is the same decline's duration against the same list. Both exist only while a decline is running, which makes their broken, stepped appearance correct rather than a rendering fault: each climbs as the decline extends, levels off once the floor is set, and vanishes when the decline completes. The background is tinted throughout a running decline.
The table reports how far price sits beneath the strongest close loaded; the running decline in percent and bars along with which kind of peak it started from; the drop percentile with its count and error; the duration percentile likewise; the median of finished declines; the tally of declines seen, the one discarded, any evicted by the ceiling, and bars read; and the status line.
The data panel carries the three distance figures, the decline's drop and bar count, bars elapsed since its peak, the high-water label as one or nought, list size, declines seen, the discard count, the eviction count, bars read, bars passed over for an unusable close, and both standard errors.
THE SETTINGS
Decline size, in percent, which sets both the opening and the closing edge.
List ceiling. Oldest entries leave first once it fills, and the number that have left is reported on screen. Should this be set below the minimum below, the minimum yields to it, since otherwise the list would be unable to satisfy its own requirement.
Minimum finished declines before anything is reported. Twenty by default, beneath which a percentile can only take coarse steps while its error near the middle already spans eleven points.
Five switches controlling the table, each plotted line, the error band and the tint.
WHAT IT WILL NOT DO
It places no orders and has no entries or exits. Nothing here holds a position, sizes one, stops one out or sets a target.
It ships without alerts, on purpose. The obvious alert would fire when a decline opens or passes some depth, and an alert of that kind reads as an instruction however its text is worded.
It makes no prediction. What is measured is how far finished declines fell and how long they took. What followed them is measured nowhere, so nothing here can speak to what follows this one. A decline ranked near the top of the drop list has not thereby stopped falling; the file never measures that.
There is no win rate, no profit figure and no backtest. Every quantity quoted above describes this script's own output or its own arithmetic, and each is regenerated by its verification harness on every run.
A percentile here is not a probability. It is a frequency across the finished declines this particular chart has loaded, and that population is small because deep declines are rare by nature.
The lists describe whatever history produced them. If the market's behaviour changes, the readout keeps reporting the previous distribution until enough new declines have accumulated to shift it. Any historical frequency lags in this way.
The threshold has no tolerance band. A slide reaching it by a hundredth of a percent opens a decline and one falling a hundredth short does not, and the counts quoted above shift accordingly, as the threshold sweep shows.
All figures here come from a single data provider over the windows named alongside them. Load a different history and different counts follow, and the table reports what its own chart contains rather than what appears in this text.
HOW TO USE IT
Apply it to a chart of one day a bar or longer. Having enough history matters more than any setting here, because the ledger is only as deep as the loaded chart. Twenty six years of a small cap index fund's daily bars gave about 190 finished declines at the default setting; three years of bars gives about twenty, which is only just what the ledger wants before it reads.
Most of the time, no decline is running. The status line says so, gives the current distance off the last peak, and leaves the pane empty. That is the normal state, not a fault.
When the close sits 4 percent under the last peak, at the default, a decline opens: the pane tints, and two lines start plotting. Read "Depth against past" first: it shows that the running decline is already deeper than that share of finished declines on this chart, with the size of the list and the error beside it. "Length against past" says the same about how many bars it took to reach its low so far. Both are floors. A decline that is still running can get deeper and longer, so either figure can rise from here, and neither comes back down while the decline is open.
"Those past falls" gives the median finished decline, which is the plain yardstick to hold today's against. "Seen so far" says how many declines the chart produced, and whether the ledger's ceiling has pushed any old ones out.
"A fall is a drop of" sets what counts as a decline. A smaller figure gives more and shallower declines to compare against; a larger one gives fewer and deeper ones. WHAT HAPPENS WHEN YOU MOVE THE THRESHOLD has the measured effect.
Once price has moved on, the chart no longer shows two facts about a finished decline: how far it fell and how many bars it took to get there. This file keeps both, for every decline contained in the history the chart has loaded, and then reads whatever decline is running right now against those two accumulated lists.
The readout answers a narrower question than whether price is low: of all the declines this instrument has produced, how many were at or shallower than the one happening now, and how many reached their floor at least as fast.
HOW A DECLINE IS DELIMITED
One number does both jobs. A decline is declared open once the close sits that percentage under the running peak, and it is declared finished once the close climbs that same percentage back above the weakest close the decline produced. Using one threshold for both edges keeps the definition symmetric, so a decline opens and closes by the same rule.
After a decline finishes, the starting point for the next one is the strongest close recorded since that floor, rather than whichever bar happened to trip the recovery threshold. Without that, the engine would finish a decline and immediately start another from a lower point, filling the lists with fragments.
Two numbers are then appended: the drop, as a percentage from peak close to floor close, and the gap, in bars, between those two points. What price did after the decline ended is not recorded anywhere, and no part of this file looks at it.
Measured on a 24796 bar daily history of the S&P 500 index running from 1927-12-30 to 2026-09-18, with the threshold at its default of four percent, 488 declines begin and finish. The typical one drops 7.3 percent and takes 14 bars to bottom out. A percentile is printed on 7520 of those bars, roughly thirty percent of the chart.
WHY BOTH DROP AND DURATION ARE KEPT
Showing both drop and duration only makes sense if they carry different information. This was tested three ways before either was plotted.
Rank correlation first. Over the 487 ledgered declines the two rank together at +0.33. Over the 7520 bars where both percentiles print, they rank together at +0.41. The threshold at which one of them would have been deleted was fixed at 0.8 before any of this was measured. Five further instruments give +0.36, +0.34, +0.31, +0.45 and +0.47 on the same test, so the result is not specific to one history.
Rank correlation alone is not enough. Two quantities can be locked together by an exact formula and still rank near zero if the formula folds (for example, something shaped like the absolute value of twice x minus a hundred). A rank test misses that. So the pair was also tested algebraically: four candidate formulas were tried, and the closest of them still fails to reproduce one percentile from the other by 94 points somewhere on the history.
The third test assumes no particular shape. Sort the bars into twenty groups by one percentile and measure how much the other still varies inside each group. If one determined the other, that variation would collapse. It does not: roughly ninety percent of the spread remains, in both directions.
A test like that needs a reference case, so the same measurement was run on a pair that genuinely is near-identical: a percentile against the raw number underneath it. There, only eighteen percent survives. The method tells the two cases apart, so the ninety percent can be read as real.
In practice, a six percent decline that took three bars and a six percent decline that took forty produce the same number on a price chart and land in two very different places here.
WHAT THE PERCENTILE ADDS
A percentile is a relabelling. Against the raw figure beneath it, the drop percentile ranks at +0.99 and the duration percentile at +0.96, which is close to identity: nothing is reordered here. What the percentile adds is the reference list.
The percentiles also do not restate the comparison the chart already gives you, how far price sits below its highest close. Against that, they come out at -0.24 and -0.06, and the group-variation test above leaves ninety and ninety-seven percent of their spread intact.
A SPLIT THAT DID NOT HOLD UP
Every decline begins at a peak, and that peak either was or was not the highest close the chart had seen up to then. That sorts the ledger in two with no parameter to choose, and the split looked promising at first.
On the S&P history, the split looks substantial. The 103 declines starting from a high-water peak drop 6.2 percent over 16 bars at the median; the 384 starting from a lower peak drop 7.7 percent over 13. Mann-Whitney returns 4.4e-05 on drop and 0.008 on duration.
Almost all of that difference comes from volatility. A threshold expressed in percent takes longer to trip when daily moves are small, and declines beginning from a high-water peak occur in quieter conditions: 14.4 percent annualised against 17.4, p equal to 0.0002. Divide the declines into three volatility bands and the duration difference disappears inside every one of them, the most extreme p being 0.28. The drop difference falls to a smallest p of 0.021, which fails a correction for three simultaneous tests, so something may remain there but nothing has been established.
Because the mechanism is volatility, the two gaps should run in opposite directions: quieter conditions mean a slower trip to the floor. They do, on all five instruments where the volatility difference is at least one point, gold included. Gold is the instrument whose volatility ordering is inverted (high-water declines being the noisier ones there), and it is correspondingly the instrument where they reach their floor sooner rather than later. A sixth instrument has a volatility difference of only 0.9 points and a duration difference of exactly zero bars, so it neither confirms nor contradicts anything, and no claim is made about it.
The ledger is consequently not divided by this label, and every percentile is read against the complete set of finished declines. The label is still displayed for the decline in progress, because which kind of peak a decline started from is a plain observation. Showing it does not mean the ledger is split by it.
THE SAMPLE, AND HOW WRONG IT COULD BE
The very first decline to finish does not enter the ledger. Its peak is simply the highest close since whatever bar the chart begins on, with no confirmed floor preceding it, so if the loaded history opens partway into a decline that peak is an artefact of the start date. Exactly one per chart is discarded; on the S&P history it measured 4.6 percent. Both the discard and the running total appear in the readout.
A percentile drawn from twenty observations is a far weaker claim than one drawn from five hundred, so the count is printed beside every percentile along with a binomial standard error in percentile points beside that, with a one-error band shaded around the drop line. Near the middle of the distribution, that error runs 11.2 points at twenty observations and 2.3 points at the 487 the S&P history supplies; out at the ninetieth percentile, 6.7 points and 1.4. Until the minimum count is reached, nothing is printed at all and the status line reports the shortfall.
That standard error is a lower limit, not the real uncertainty. It treats the declines as independent draws, which they are not, since they arrive in clusters and a few stretches of history contribute a disproportionate share.
There is also a ceiling on the list. When it engages, the count of discarded entries appears in the readout itself and not only in the data panel, because a ceiling nobody is told about would be worse than none. At the default threshold, it does not engage on any history tested here. Tighten the threshold and it does: at three percent the same index finishes 694 declines and the oldest 193 are evicted, leaving a list describing recent history rather than all of it; at two percent, 612 are evicted.
WHAT HAPPENS WHEN YOU MOVE THE THRESHOLD
This is the only setting with real consequences. On the S&P history, and quoting the medians of the list actually retained rather than of everything that finished (since above two of these settings they are not the same set):
At two percent, 1113 declines finish, 612 are evicted, and the 500 retained run 4.0 percent over 6 bars. At three percent, 694 finish, 193 are evicted, and the 500 retained run 5.6 percent over 11 bars; across all 694 the figures would be 5.8 percent and 9 bars, which is why the distinction is drawn rather than glossed over. At four percent, 488 finish and 487 are retained at 7.3 percent over 14 bars. At five percent, 339 finish and 338 are retained at 8.9 percent over 17. At eight percent, 151 finish and 150 are retained at 13.9 percent over 35 bars.
A tighter threshold splits one long slide into several declines; a looser one merges separate slides into one. Neither setting is correct in general.
Four percent is the default for one stated reason: sweeping the threshold in steps of a tenth, it is the tightest value at which the list ceiling stays out of the way on the longest history tested. Every value from 3.0 to 3.9 evicts something, from 193 entries down to 10, and 4.0 evicts nothing. That criterion is deliberately blind to any result the file produces, touching no correlation, no p value and no median. It is also relative to the ceiling setting rather than a property of markets: raise the ceiling and a tighter default would qualify, lower it and a looser one would.
WHEN THE NUMBERS MOVE AND WHEN THEY STOP
Only closes matter here, and only from bars that have finished. The live bar's contribution shifts while that bar is still trading and becomes final when it closes; once a bar is behind you, its printed values are not revised. That was verified by recomputing the entire series on charts cut short at seven different bars and comparing 30 output series and table cells against the corresponding bars of the uncut run. Two of those cuts land deliberately on awkward bars (the one where a decline is confirmed and the one at its floor) rather than on quiet stretches. All seven agree exactly. One cut leaves only 22 entries in the list against the full 487, so the comparison covers a thinly-supplied reading and not merely the arithmetic.
Within a single decline, both quantities only increase. The weakest close can fall further but cannot recover, and the bar carrying it can only move later. A percentile printed mid-decline is therefore a floor on the final one: it climbs, it does not retreat, and once the weakest close stops making new lows it holds steady while the recovery plays out. A decline sitting mid-table today will not necessarily finish there. On the S&P history, 374 of the 488 declines spent more than one bar recovering with their figures already frozen.
Nothing outside the chart's own symbol is requested, and no windowed statistic is computed anywhere. There is no second trading calendar that could drift out of alignment and no warm-up governed by another instrument's holidays.
CHARTS THIS REFUSES
Synthetic-price charts are rejected ahead of everything else and by name. On Heikin Ashi, Renko, Kagi, Line Break, Point and Figure and Range charts, the close is a manufactured figure rather than something that changed hands. The danger is that nothing would look wrong: every other condition would be satisfied, the status line would report normally, and the list would accumulate drops and durations belonging to price action that did not occur. Heikin Ashi is the worst case, since its close is an average and averages suppress exactly the extremes this file is counting.
A bar has to represent a full session or more. Because everything here is expressed in bars rather than calendar days, charts of two, three or five days per bar are consistent and are accepted: such a chart compares bars against a list assembled from bars of identical size. Intraday, tick and seconds charts are rejected explicitly, though the status line groups all three under one message, since on those the running peak becomes an intraday print and the lists turn into a record of intraday wiggles. That is a choice about what this file is for; the arithmetic itself would still run.
A bar whose close is missing or not positive is passed over individually rather than condemning the whole chart, because a percentage drop from such a value has no meaning. How many were passed over is reported in the data panel.
Under any rejection, all 19 plotted series go empty, the shaded band and the background tint vanish, all six value cells collapse to a dash, the row captions remain, and the status line does the only talking. The three horizontal guides at 0, 50 and 100 also remain, since they are fixed constants carrying no measurement.
Six status messages exist altogether: the synthetic-chart rejection, the sub-session rejection, the unusable-close rejection, no decline currently running, list still filling, and normal operation.
THE CHART'S HISTORY MATTERS MORE THAN THE SETTINGS
Each decline's peak is the strongest close since the previous floor, and the high-water label compares that peak against the strongest close the chart has loaded. Begin a chart partway into a decline and the engine starts out assuming price is at a summit.
The size of that effect is measurable. Across the complete S&P history, 21.1 percent of retained declines carry the high-water label. Start the identical index at the March 2009 low, 4410 bars, and it becomes 46.3 percent, because on that chart the running high is not the real one. Neither figure is mistaken; they answer questions about different quantities of history, and the readout reports the declines counted and bars read so the discrepancy is visible rather than guessed at.
List size behaves the same way. At the default, the full S&P history yields 487 retained declines, the Nasdaq Composite 305, a broad-market ETF starting 1993 yields 172, a Nasdaq-tracking ETF from 1999 yields 218, a small-cap ETF from 2000 yields 190, and a gold ETF from 2004 yields 109. Short history means a short list, a wide error band, and below the minimum no reading whatsoever. The fix is more history, not a smaller minimum.
WHAT IS ON SCREEN
The pane holds two series scaled nought to a hundred. Heavy purple is the running decline's drop expressed as a percentile of finished ones, wrapped in its shaded error band. Thin orange is the same decline's duration against the same list. Both exist only while a decline is running, which makes their broken, stepped appearance correct rather than a rendering fault: each climbs as the decline extends, levels off once the floor is set, and vanishes when the decline completes. The background is tinted throughout a running decline.
The table reports how far price sits beneath the strongest close loaded; the running decline in percent and bars along with which kind of peak it started from; the drop percentile with its count and error; the duration percentile likewise; the median of finished declines; the tally of declines seen, the one discarded, any evicted by the ceiling, and bars read; and the status line.
The data panel carries the three distance figures, the decline's drop and bar count, bars elapsed since its peak, the high-water label as one or nought, list size, declines seen, the discard count, the eviction count, bars read, bars passed over for an unusable close, and both standard errors.
THE SETTINGS
Decline size, in percent, which sets both the opening and the closing edge.
List ceiling. Oldest entries leave first once it fills, and the number that have left is reported on screen. Should this be set below the minimum below, the minimum yields to it, since otherwise the list would be unable to satisfy its own requirement.
Minimum finished declines before anything is reported. Twenty by default, beneath which a percentile can only take coarse steps while its error near the middle already spans eleven points.
Five switches controlling the table, each plotted line, the error band and the tint.
WHAT IT WILL NOT DO
It places no orders and has no entries or exits. Nothing here holds a position, sizes one, stops one out or sets a target.
It ships without alerts, on purpose. The obvious alert would fire when a decline opens or passes some depth, and an alert of that kind reads as an instruction however its text is worded.
It makes no prediction. What is measured is how far finished declines fell and how long they took. What followed them is measured nowhere, so nothing here can speak to what follows this one. A decline ranked near the top of the drop list has not thereby stopped falling; the file never measures that.
There is no win rate, no profit figure and no backtest. Every quantity quoted above describes this script's own output or its own arithmetic, and each is regenerated by its verification harness on every run.
A percentile here is not a probability. It is a frequency across the finished declines this particular chart has loaded, and that population is small because deep declines are rare by nature.
The lists describe whatever history produced them. If the market's behaviour changes, the readout keeps reporting the previous distribution until enough new declines have accumulated to shift it. Any historical frequency lags in this way.
The threshold has no tolerance band. A slide reaching it by a hundredth of a percent opens a decline and one falling a hundredth short does not, and the counts quoted above shift accordingly, as the threshold sweep shows.
All figures here come from a single data provider over the windows named alongside them. Load a different history and different counts follow, and the table reports what its own chart contains rather than what appears in this text.

Aviso legal
As informações e publicações não se destinam a ser, e não constituem, conselhos ou recomendações financeiras, de investimento, comerciais ou de outro tipo fornecidos ou endossados pela TradingView. Leia mais nos Termos de Uso.
Aviso legal
As informações e publicações não se destinam a ser, e não constituem, conselhos ou recomendações financeiras, de investimento, comerciais ou de outro tipo fornecidos ou endossados pela TradingView. Leia mais nos Termos de Uso.