OPEN-SOURCE SCRIPT
Atualizado Gann Sq9 & Sq144 Dashboard [KG]
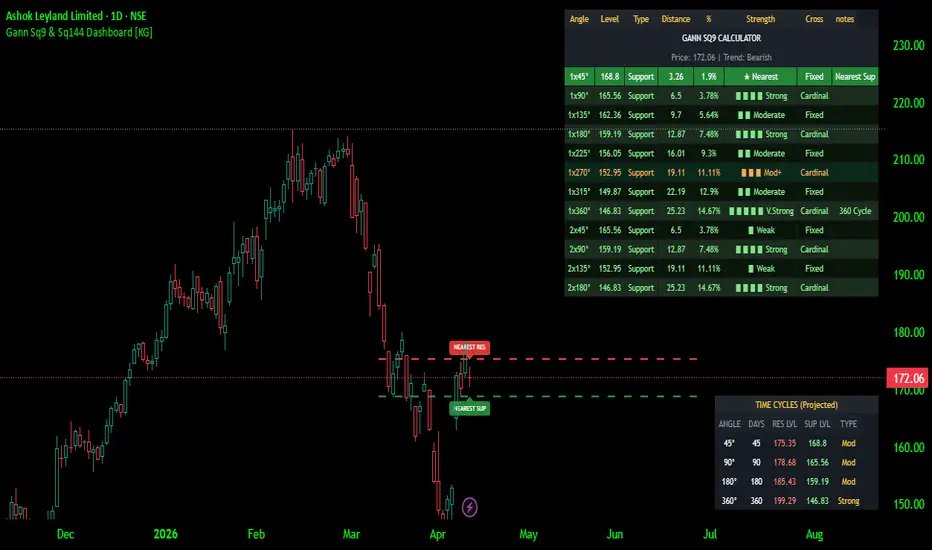
Gann SQ9 & 144 Dashboard is a comprehensive technical indicator that implements W.D. Gann’s Square of 9 (and Square of 144) methodology. It calculates dynamic support and resistance levels based on the current price, classifies them by angle strength, and presents the data in an interactive dashboard. The script also includes a trend filter (moving average), projected time cycles, and visual chart lines for the nearest levels.
How to Read the Dashboard>>>>>>>
The script creates 2 tables on the chart:
1. Main Levels Table (Top‑Right)
ANGLE- Format: n x deg° where n = step number (1–12) and deg = Gann angle (45°, 90°, …, 360°).
LEVEL- Calculated price level (resistance or support).
TYPE- Resistance (above current price) or Support (below).
DIST- Absolute distance from current price.
% - Distance as a percentage of current price.
Strength- Relative strength: ★ Nearest, ▮▮▮▮▮ V. Strong (360°), ▮▮▮▮ Strong (180°, 90°), ▮▮▮ Mod+ (270°), ▮▮ Moderate (n=1), ▮ Weak.
CROSS- Cardinal (90°, 180°, 360°) or Fixed (45°, 135°, 225°, 315°) – indicates Gann cross type.
NOTES- Additional info (e.g., “Nearest Res”, “360 Cycle”).
Colour coding helps to quickly identify key levels:
Nearest levels: bright red (resistance) / bright green (support),
Major (cardinal) levels: darker red/green with bold text,
Other resistance: dark red background,
Other support: dark green background.
2. Time Cycles Table (Bottom‑Right)
Projects how the price would evolve after a certain number of days (angle in degrees → days).
For each angle (45°, 90°, 180°, 360°) it shows:
DAYS – the time increment
RES LVL – projected resistance level after that many days
SUP LVL – projected support level
TYPE – “Strong” (360°) or “Mod”
3. Chart Lines (if enabled)
Nearest Resistance – dashed red line with label
Nearest Support – dashed green line with label
Time Frame & Recalculation>>>>>>>>>>>>
Works on any timeframe (1m, 1h, daily, weekly, etc.) – calculations are purely price‑based.
The script only executes on the last historical bar.
→ The dashboard and lines are static snapshots based on the current price. They do not update intra‑bar or historically.
For real‑time analysis, simply refresh the chart or switch to a different symbol/timeframe – the script will recalculate using the latest close price.
Utility: –
Identify key Gann levels – Quickly see where the most important resistance and support levels lie relative to the current price.
Gauge level strength – The “Strength” column tells you which levels are mathematically “stronger” according to Gann theory.
Trend filter – Activate the moving average filter (Use Trend Filter (MA)) to show only:
Resistances when the trend is Bullish (price > MA)
Supports when the trend is Bearish (price < MA)
This avoids clutter and aligns levels with the prevailing direction.
Time projection – The time cycles table gives an estimate of where price might be after a certain number of days, useful for swing trading or position planning.
Visual trading aids – The dashed lines highlight the nearest support/resistance, helping you set stop‑losses, take‑profits, or entry points.
Disclaimer: =
This script is provided for educational and informational purposes only.
It does not constitute financial advice, trading recommendations, or investment guidance.
Past performance and calculated Gann levels do not guarantee future results.Always combine technical analysis with proper risk management and, if needed, consult a qualified financial advisor. Best Regards
How to Read the Dashboard>>>>>>>
The script creates 2 tables on the chart:
1. Main Levels Table (Top‑Right)
ANGLE- Format: n x deg° where n = step number (1–12) and deg = Gann angle (45°, 90°, …, 360°).
LEVEL- Calculated price level (resistance or support).
TYPE- Resistance (above current price) or Support (below).
DIST- Absolute distance from current price.
% - Distance as a percentage of current price.
Strength- Relative strength: ★ Nearest, ▮▮▮▮▮ V. Strong (360°), ▮▮▮▮ Strong (180°, 90°), ▮▮▮ Mod+ (270°), ▮▮ Moderate (n=1), ▮ Weak.
CROSS- Cardinal (90°, 180°, 360°) or Fixed (45°, 135°, 225°, 315°) – indicates Gann cross type.
NOTES- Additional info (e.g., “Nearest Res”, “360 Cycle”).
Colour coding helps to quickly identify key levels:
Nearest levels: bright red (resistance) / bright green (support),
Major (cardinal) levels: darker red/green with bold text,
Other resistance: dark red background,
Other support: dark green background.
2. Time Cycles Table (Bottom‑Right)
Projects how the price would evolve after a certain number of days (angle in degrees → days).
For each angle (45°, 90°, 180°, 360°) it shows:
DAYS – the time increment
RES LVL – projected resistance level after that many days
SUP LVL – projected support level
TYPE – “Strong” (360°) or “Mod”
3. Chart Lines (if enabled)
Nearest Resistance – dashed red line with label
Nearest Support – dashed green line with label
Time Frame & Recalculation>>>>>>>>>>>>
Works on any timeframe (1m, 1h, daily, weekly, etc.) – calculations are purely price‑based.
The script only executes on the last historical bar.
→ The dashboard and lines are static snapshots based on the current price. They do not update intra‑bar or historically.
For real‑time analysis, simply refresh the chart or switch to a different symbol/timeframe – the script will recalculate using the latest close price.
Utility: –
Identify key Gann levels – Quickly see where the most important resistance and support levels lie relative to the current price.
Gauge level strength – The “Strength” column tells you which levels are mathematically “stronger” according to Gann theory.
Trend filter – Activate the moving average filter (Use Trend Filter (MA)) to show only:
Resistances when the trend is Bullish (price > MA)
Supports when the trend is Bearish (price < MA)
This avoids clutter and aligns levels with the prevailing direction.
Time projection – The time cycles table gives an estimate of where price might be after a certain number of days, useful for swing trading or position planning.
Visual trading aids – The dashed lines highlight the nearest support/resistance, helping you set stop‑losses, take‑profits, or entry points.
Disclaimer: =
This script is provided for educational and informational purposes only.
It does not constitute financial advice, trading recommendations, or investment guidance.
Past performance and calculated Gann levels do not guarantee future results.Always combine technical analysis with proper risk management and, if needed, consult a qualified financial advisor. Best Regards
Notas de Lançamento
Added 1) Table position inputs & 2) Text size inputsScript de código aberto
Em verdadeiro espírito do TradingView, o criador deste script o tornou de código aberto, para que os traders possam revisar e verificar sua funcionalidade. Parabéns ao autor! Embora você possa usá-lo gratuitamente, lembre-se de que a republicação do código está sujeita às nossas Regras da Casa.

Aviso legal
As informações e publicações não se destinam a ser, e não constituem, conselhos ou recomendações financeiras, de investimento, comerciais ou de outro tipo fornecidos ou endossados pela TradingView. Leia mais nos Termos de Uso.
Script de código aberto
Em verdadeiro espírito do TradingView, o criador deste script o tornou de código aberto, para que os traders possam revisar e verificar sua funcionalidade. Parabéns ao autor! Embora você possa usá-lo gratuitamente, lembre-se de que a republicação do código está sujeita às nossas Regras da Casa.
Aviso legal
As informações e publicações não se destinam a ser, e não constituem, conselhos ou recomendações financeiras, de investimento, comerciais ou de outro tipo fornecidos ou endossados pela TradingView. Leia mais nos Termos de Uso.