MarketProfile HL
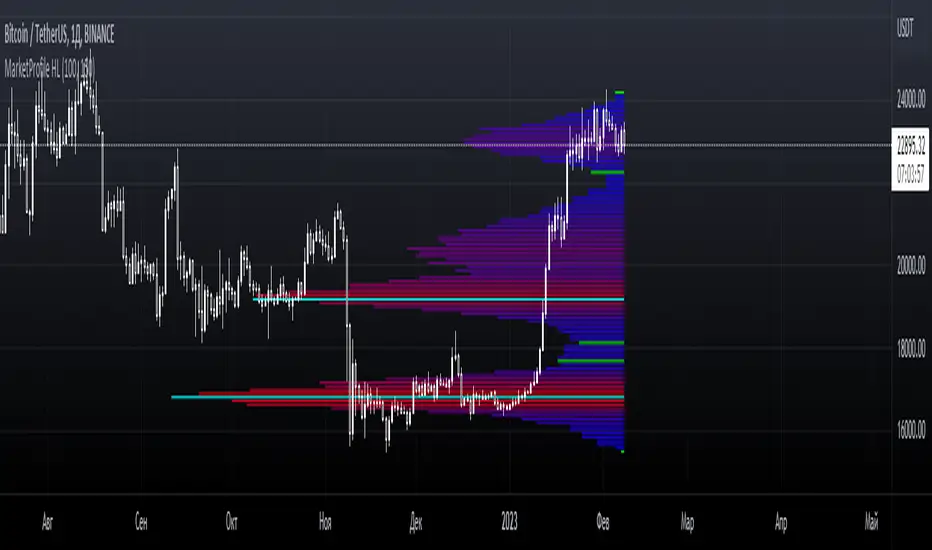
The gradient color of the levels shows where more or less horizontal volume accumulates.
Adapts to any timeframe or instrument.
Customizable display of horizontal levels HL and POC.
The HL and POC levels protrude beyond the boundaries of the main histogram on the right for a more convenient determination of dynamic centers and accumulation boundaries.
-------------------------------------------
MarketProfile HL динамически рассчитывает и отображает боковую гистограмму распределения объемов с цветами по градиенту, которая настроена на заданное количество свечей. Гистограмма накладывается на свечи, чтобы визуально представить области рыночного баланса и дисбаланса. Индикатор использует концепции статистического распределения и основан на теории профиля рынка.
Градиентный цвет уровней показывает, где накапливается больше или меньше горизонтального объема.
Адаптируется к любому таймфрейму или инструменту.
Настраиваемое отображение горизонтальных уровней HL и POC.
Уровни HL и POC выступают за границы основной гистограммы справа для более удобного определения динамических центров и границ накоплений.
Settings are simplified for faster configuration.
-------------------------------------------
Полное обновление индикатора с новой логикой расчета и оптимизацией. Цвета фиксированы и обновляются для правильного градиента. Уровни POC и HL показывают правильную длину и соответствуют фактическим накоплениям.
Настройки упрощены для более быстрой навигации.
The color display system was redesigned. Flexible customization is now available. You can customize the histogram gradient, including color transitions, as well as separately set the color of the central accumulation zone and its edges. This allows the visual component of the indicator to be tailored to personal preferences, the chart theme, and the analysis tasks, and also makes the accumulation structure more visually clear.
A histogram Shift parameter has been added. This allows the histogram to be moved away from the candlesticks, simplifying visual analysis and reducing overlapping elements on the chart. The histogram can be effectively locked to the right edge if the chart remains stationary, which is especially convenient for detailed analysis of the current situation without scrolling.
Script sob convite
Apenas usuários aprovados pelo autor podem acessar este script. Você precisará solicitar e obter permissão para usá-lo. Isso geralmente é concedido após o pagamento. Para mais detalhes, siga as instruções do autor abaixo ou entre em contato diretamente com CryptoLevels.
A TradingView NÃO recomenda pagar ou usar um script, a menos que você confie totalmente em seu autor e entenda como ele funciona. Você também pode encontrar alternativas gratuitas e de código aberto em nossos scripts da comunidade.
Instruções do autor

📅 Ежедневный анализ: t.me/cryptolevels_ru
Aviso legal
Script sob convite
Apenas usuários aprovados pelo autor podem acessar este script. Você precisará solicitar e obter permissão para usá-lo. Isso geralmente é concedido após o pagamento. Para mais detalhes, siga as instruções do autor abaixo ou entre em contato diretamente com CryptoLevels.
A TradingView NÃO recomenda pagar ou usar um script, a menos que você confie totalmente em seu autor e entenda como ele funciona. Você também pode encontrar alternativas gratuitas e de código aberto em nossos scripts da comunidade.
Instruções do autor
📅 Ежедневный анализ: t.me/cryptolevels_ru