Atualizado
CQ_Breakout Probability (Expo)
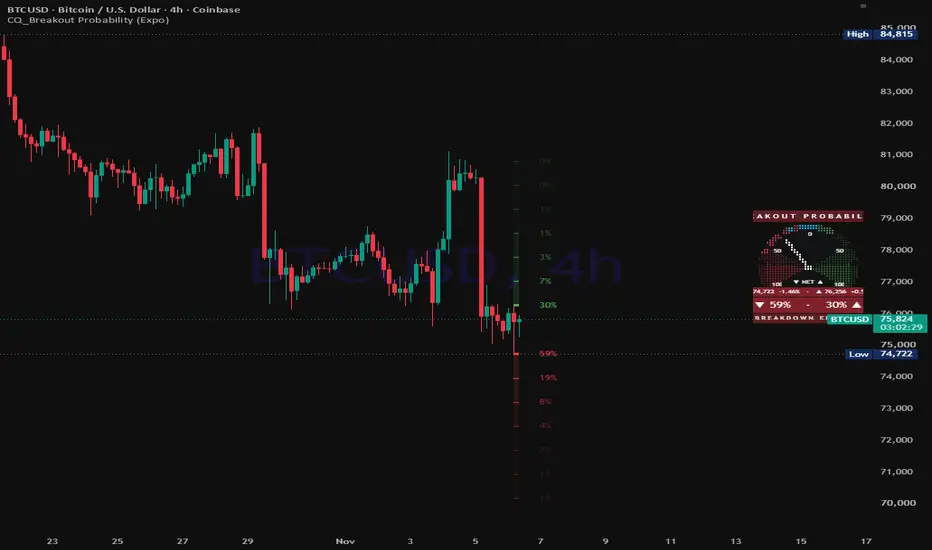
================================================================================
CQ_BREAKOUT PROBABILITY (EXPO) — USER MANUAL
TradingView Pine Script v6 Indicator
================================================================================
Original indicator : "Breakout Probability (Expo)" by Zeiierman
License : Creative Commons Attribution-NonCommercial-ShareAlike 4.0
(CC BY-NC-SA 4.0)
creativecommons.org/licenses/by-nc-sa/4.0/
This adaptation : CQ edition by CQuevedo345 — converted to Pine Script v6,
accuracy fixes, extended level ladder, highlight & fade,
Labels/Boxes captions, hover details, expanded
statistics panel and Probability Pixel Dials.
All credit for the original concept and core statistical method belongs to
Zeiierman. Under the CC BY-NC-SA 4.0 license, this adaptation may not be used
commercially, and any further adaptation must credit the original author and
be shared under the same license.
--------------------------------------------------------------------------------
TABLE OF CONTENTS
--------------------------------------------------------------------------------
1. What the indicator does
2. How the probabilities are calculated
3. Quick start
4. Reading the chart (Classic mode)
5. Reading the Probability Pixel Dial (Pixel Gauge mode)
6. Settings reference
6.1 📐 Levels
6.2 🎨 Lines & Fill
6.3 ✨ Highlight & Fade
6.4 🏷️ Labels
6.5 📊 Statistics Panel
6.6 🧭 Probability Pixel Dials — Layout
6.7 🎨 Probability Pixel Dials — Style
6.8 🌙 Probability Pixel Dials — Auto Dim
6.9 🔔 Alerts
7. Alerts — setup
8. Changes from the original script
9. Tips, limitations and troubleshooting
10. Glossary
================================================================================
1. WHAT THE INDICATOR DOES
================================================================================
Breakout Probability answers one question on every bar:
"Based on history, how likely is the CURRENT bar to trade above the
previous bar's high — or below the previous bar's low — and how likely
is it to reach levels farther out?"
It draws a ladder of price levels above the previous high and below the
previous low, and labels each one with the historical percentage of bars that
reached it. The statistics are counted separately for bars that follow a GREEN
candle and bars that follow a RED candle, because what the previous candle did
changes the odds.
On top of that the CQ edition adds:
• A Statistics Panel with the current bias, both Level 1 odds, the odds
after green and red candles, sample sizes and a bias backtest.
• A Probability Pixel Dial — a round 240° instrument gauge built from table
cells, in the same style as the other CQ pixel dials — showing breakout
and breakdown odds at a glance.
• Highlighting of the levels nearest to price, a gradient fade on the outer
levels, Labels or Boxes captions, and detailed hover tooltips.
The indicator works on any symbol and any timeframe. "Bar" always means a bar
of the chart timeframe you are on.
================================================================================
2. HOW THE PROBABILITIES ARE CALCULATED
================================================================================
THE LEVELS
For the current bar, the ladder is built from the PREVIOUS bar:
Upper Level 1 = previous high
Upper Level n = previous high + (n − 1) × Step
Lower Level 1 = previous low
Lower Level n = previous low − (n − 1) × Step
Step = previous close × Percentage Step %
Example — Percentage Step 1%, previous close 100,000, previous high 101,000,
previous low 99,000:
Upper L1 101,000 · L2 102,000 · L3 103,000 … L7 107,000
Lower L1 99,000 · L2 98,000 · L3 97,000 … L7 93,000
The step comes from the previous close, so the levels stay fixed for the
whole bar instead of drifting with the live price.
THE COUNTS
When each bar CLOSES, the script records:
• the color of the candle before it (green: close > open, red:
close < open),
• which upper levels the bar's high reached,
• which lower levels the bar's low reached.
The probability for a level is:
hits for that level after a candle of this color
───────────────────────────────────────────────── × 100
all closed bars that followed a candle of this color
The odds shown for the current bar use the statistics of the previous
candle's color. After a doji (open = close) the red statistics are shown,
and the doji bar itself is not counted.
NO LOOKAHEAD
Only CLOSED bars are counted. The bar that is still forming never changes the
statistics or the odds it is shown, and the backtest scores each bar using
only the odds that were known when that bar opened.
THE BIAS
The bias is the side whose Level 1 has the higher odds:
BULLISH — previous high more likely to be reached
BEARISH — previous low more likely to be reached
If the two are equal, the bias is BULLISH.
THE BACKTEST
At every bar close, the bias that was known at that bar's open is scored:
WIN — the bar reached the side the bias predicted
LOSS — it did not
Profitability = WIN ÷ (WIN + LOSS)
This is a hit rate of the bias, NOT a trading profit-and-loss figure. It
ignores entries, exits, stops, fees and the size of the move.
IMPORTANT
Every percentage is a historical frequency from the bars loaded on your
chart, not a prediction or a guarantee. Results differ between symbols,
timeframes and how much history is loaded. Use them as context, not as a
trading signal on their own.
================================================================================
3. QUICK START
================================================================================
1. Add the indicator to a chart. By default you get:
• 7 levels above the previous high and 7 below the previous low, each
with its probability label (Classic mode).
• A single merged Probability Pixel Dial at Middle Right
(Pixel Gauge mode).
• Indicator Mode = "Classic + Pixel Gauge" (both at once).
2. Hover any level label, or any tag row on the dial, for the full
explanation of that number.
3. Pick what you want to see under 📐 Levels → Indicator Mode.
4. Turn on 📊 Statistics Panel → Show Statistic Panel for the full statistics
and the bias backtest (off by default).
5. For alerts, see section 7.
Load as much history as practical. The more closed bars there are, the more
reliable the percentages. The panel's "Sample (G / R)" row and every tooltip
show how many bars each figure is based on.
================================================================================
4. READING THE CHART (CLASSIC MODE)
================================================================================
LEVEL LINES
• Upper color (green by default): levels above the previous high.
• Lower color (red by default): levels below the previous low.
• The pair closest to price — the nearest level above and the nearest level
below the current price — is HIGHLIGHTED: drawn thicker at full color.
Usually that is the previous high and low; after a breakout the highlight
moves to whichever levels now bracket price.
• Each level farther from price FADES step by step: line, label text and
background fill.
LABELS / BOXES
• Each level shows its probability, e.g. 63%.
• Caption Mode "Labels": floating text next to the line.
• Caption Mode "Boxes": a thin captioned box riding on the level line.
HOVER DETAILS (tooltip on every label or box)
▲ UPPER LEVEL 3 of 7
━━━━━━━━━━━━━━━━━━━━
Breakout probability: 18% (≈ 1 in 5.6)
Sample: reached on 94 of 524 closed bars that followed a GREEN candle.
Level price: 102,000
2 × 1% step above the previous high (+2,000).
Distance from current price: +1.84%
Current bar: ⏳ not reached yet
Opposite lower level at the same distance: 12%
Level 1 bias: BULLISH — prev high 63% vs prev low 41%
How to read it: …
The tooltip covers:
• the probability and its "1 in N" equivalent,
• the sample size behind it,
• how the level is built,
• its distance from the current price,
• whether the current bar has already reached it,
• the odds of the mirror level on the other side,
• the overall bias.
BACKGROUND FILL
Shaded bands between adjacent levels, in the upper / lower colors, fading
with the outer levels.
================================================================================
5. READING THE PROBABILITY PIXEL DIAL (PIXEL GAUGE MODE)
================================================================================
The dial is drawn from table cells (a 41 × 27 pixel grid per dial), pinned to
the screen, with the same face, needle, hub, themes and night lighting as the
other CQ pixel dials.
MERGED DIAL (default — "Merge Into Single Dial" ON)
50 50
100 ╭───── 0 ─────╮ 100
│ BREAKDOWN ▼ │ BREAKOUT ▲
│ (left) │ (right)
▼ NET ▲
• RIGHT half of the arc = BREAKOUT side (Upper color). Lit from the top out
to the odds of reaching the previous high.
• LEFT half of the arc = BREAKDOWN side (Lower color). Lit from the top out
to the odds of reaching the previous low.
• The scale reads 100 · 50 · 0 · 50 · 100: 0 at the top, 100% at each end.
• The NEEDLE points at the NET EDGE = breakout odds − breakdown odds.
Straight up → balanced
Toward right → breakout edge
Toward left → breakdown edge
• Zone dividers (notches) at 30 / 50 / 70 on each half, plus 0 at the top.
• Wedges: Leaning (50–70%) and Strong (70–100%), shaded on each half in that
side's color.
• Deeper-level ticks: bright marks on the arc at the odds of L2, L3 … on each
side, showing how quickly the odds drop past the previous high / low.
Tag rows:
Title B R E A K O U T P R O B A B I L I T Y
Levels ▼ prev low price distance % · ▲ prev high price distance %
Reading ▼ breakdown odds · breakout odds ▲
Zone BALANCED (edge within ±10 points)
BREAKOUT EDGE +n / BREAKDOWN EDGE −n
✅ HIGH BROKEN / ✅ LOW BROKEN / ✅ BOTH BROKEN
(the level was reached on the current bar)
The tag rows are colored by the side that has the edge. Hover any tag for the
net edge plus the full level-by-level breakout AND breakdown breakdown.
SEPARATE DIALS ("Merge Into Single Dial" OFF)
• BREAKOUT ▲ dial: the needle shows the odds of reaching the previous high.
The scale runs 0 → 100 left to right.
• BREAKDOWN ▼ dial: the same for the previous low.
• The zone tag on each dial reads:
LOW ODDS (< 30%)
BELOW EVEN (30–50%)
LEANING (50–70%)
STRONG ODDS (70%+)
✅ BROKEN (the level was reached on the current bar)
• "Dials" chooses Both, Breakout (High) only or Breakdown (Low) only.
NUMBER FORMAT ON THE DIAL
• Prices and price distances are always whole numbers (e.g. 101,250).
• Distance % shows two decimals.
• Odds follow "Remove Decimals from Percentages" (🏷️ Labels).
The dial is hidden until at least one comparable bar has closed.
================================================================================
6. SETTINGS REFERENCE
================================================================================
(Defaults in brackets. Every setting also has a tooltip in the settings
window.)
--------------------------------------------------------------------------------
6.1 📐 LEVELS
--------------------------------------------------------------------------------
Indicator Mode [Classic + Pixel Gauge]
Classic Level lines, labels/boxes, highlight & fade, fill.
Pixel Gauge Probability Pixel Dial(s) only; no lines on chart.
Classic + Pixel Gauge Both.
The Statistics Panel and alerts work in every mode.
Percentage Step [1.0]
Distance between levels as a % of the previous close. Smaller = tighter
levels with higher odds; larger = wider targets with lower odds. Changing
it recalculates all history.
Number of Lines [7] (1–7)
Levels drawn on each side. Statistics for all 7 are always calculated.
Disable 0.00% [ON]
Hides a level pair if either side has never been reached for the current
candle color. A level that rounds to "0%" but was reached at least once is
still shown.
--------------------------------------------------------------------------------
6.2 🎨 LINES & FILL
--------------------------------------------------------------------------------
Upper / Lower [green / red]
Colors of the levels above the previous high and below the previous low.
Also used for label text, fill, and the dial arcs.
Width / Style [2 / Solid] Solid · Dashed · Dotted
Line Length (bars back) [1] (1–500)
How far back from the current bar each line starts.
Extend Right (bars) [0] (0–10)
How far past the current bar the lines extend. Right-side captions move
out with the line end.
BG Color / Transparency [ON / 80]
Fill between adjacent levels; 0 = solid, 100 = invisible.
--------------------------------------------------------------------------------
6.3 ✨ HIGHLIGHT & FADE
--------------------------------------------------------------------------------
Highlight Nearest Levels / Width [ON / 4]
The nearest level above and below the current price are drawn thicker at
full color. Updates live.
Fade Outer Levels / Step / Max [ON / 20 / 80]
Each level beyond the highlighted ones is Step % fainter than the one
before (lines, labels, fill), up to Max %, so the outer levels stay
visible.
--------------------------------------------------------------------------------
6.4 🏷️ LABELS
--------------------------------------------------------------------------------
Show Labels [ON]
Bar Spacing [1] (−1 to 50)
Whole bars between the caption and the line end.
0 = touching
−1 = pulled one bar back, overlapping the line end
Right side counts from the end of the line; Left side counts from its
start.
Fine Spacing [0] (0–20)
Extra blank characters between the text and the line, for nudges smaller
than one bar. Labels mode only.
Hover Details [ON]
Detailed tooltip on every label / box (see section 4).
Remove Decimals from Percentages [ON]
Whole-number percentages (63%) in the labels, tooltips, panel, alerts and
dial odds. OFF = two decimals (62.84%). Display only; the calculations
always use exact values.
Side [Right] Right · Left
Right = after the current bar; Left = in front of the level lines.
Size [Normal] Tiny · Small · Normal · Large · Huge
Caption Mode [Labels] Labels · Boxes
Labels = floating text. Boxes = thin captioned box on the line itself,
with a light fill and a border in the level color.
Box Width / Height % [6 bars / 0.08% of price]
Size of each caption box (Boxes mode). Keep the height small so the box
stays thin.
--------------------------------------------------------------------------------
6.5 📊 STATISTICS PANEL
--------------------------------------------------------------------------------
Show Statistic Panel [OFF]
Position / Text [Top Right / Auto]
Win / Loss / Profitability colors [green / red / white]
Profitability uses chart text color [ON] adapts to light/dark themes
Frame / Width [gray 50% / 3] Width 0 removes the frame
Panel rows (hover any row for its explanation):
BREAKOUT PROBABILITY header
Prev Candle GREEN / RED / DOJI
Current Bias BULLISH ▲ / BEARISH ▼
Odds → Prev High Level 1 upside odds for the current setup
Odds → Prev Low Level 1 downside odds for the current setup
Bias This Bar ✅ Reached / ⏳ Pending
After GREEN (H / L) Level 1 high / low odds after green candles
After RED (H / L) Level 1 high / low odds after red candles
Sample (G / R) closed bars behind each set of statistics
Step Percentage Step and its price value
WIN / LOSS bias backtest counts
Profitability WIN ÷ (WIN + LOSS)
Bars Scored bars included in the backtest
Place the panel and the dial in different screen positions; two tables in
the same spot draw on top of each other.
--------------------------------------------------------------------------------
6.6 🧭 PROBABILITY PIXEL DIALS — LAYOUT
--------------------------------------------------------------------------------
Merge Into Single Dial [ON]
One combined dial (section 5). OFF = separate BREAKOUT / BREAKDOWN dials.
Dials [Both] Both · Breakout (High) · Breakdown (Low)
Separate-dial mode only.
Position [Middle Right]
Pixel Width / Height (% of chart) [0.15 / 0.3]
Size of one dial pixel. Adjust together until the dial looks round on
your screen (wide monitors need a smaller width than height).
Dial Size (×) [1.0] scales the whole dial without distorting it
Separation Between Dials [0 px] separate-dial mode
Left Padding [0 px] slides the dial(s) right
Scale Number Size [Tiny] scale numbers and the bottom caption
Needle Thickness [2] the hub grows with it
Title / Level / Reading / Zone Tag Size [Small / Tiny / Normal / Tiny]
--------------------------------------------------------------------------------
6.7 🎨 PROBABILITY PIXEL DIALS — STYLE
--------------------------------------------------------------------------------
Dial Color Theme [Aircraft Instrument]
Options: Custom, Beige VU Meter, Aircraft Instrument, Volkswagen Tacho,
Racing White Face, Amber Night, Marine Brass, Night Vision Green, Cockpit
Night, Illuminated Instrument. Custom uses the three color inputs below.
The arc always uses the Upper / Lower level colors (night gain/loss colors
while a Night Palette is active).
Dial Face Gradient / Bottom Opacity % [ON / 60]
Fades the face from top to bottom.
Dial Face / Scale Number / Needle Color Custom theme only
Unlit Arc Transparency [75] the part of the arc beyond the reading
Zone Dividers [ON] notches at 30 / 50 / 70
Odds Zone Wedges [ON]
Leaning 50–70 Opacity % [20] · Strong 70–100 % [40]
Deeper Level Ticks / color [ON / #00B0FF]
Marks the odds of L2, L3 … on the arc.
--------------------------------------------------------------------------------
6.8 🌙 PROBABILITY PIXEL DIALS — AUTO DIM
--------------------------------------------------------------------------------
(Same night-lighting system as the rest of the CQ pixel dials.)
Auto Dim Pixel Dials [ON]
Cuts the dial's opacity during the Dim Period. Applies only while the
Night Palette is Off.
Dim Amount % [50]
Dim Period [1900-0700] may cross midnight
Dim Timezone [America/Chicago] blank = exchange timezone
Night Palette [Cockpit Night]
Off opacity dimming only
Cockpit Night edge-lit incandescent panel: near-black face,
amber numerals, bright pointer, dimmed
annunciator green/red arcs, tag rows at 25%
opacity with text in the same color
Illuminated Instrument LED-backlit cluster: bright amber numerals,
orange-red pointer, cool-lit arcs, tag rows keep
their level color faded to 15% with brightened
text
Panel Rheostat % [85] night brightness, like a cockpit dimmer knob
Needle Halo (Night) [ON] faint glow around the needle and hub
The dimming uses the real clock, so it works on any timeframe. Pine only
redraws on incoming ticks, so the switch happens on the first tick after the
period starts or ends.
--------------------------------------------------------------------------------
6.9 🔔 ALERTS — ANY ALERT() FUNCTION CALL
--------------------------------------------------------------------------------
Ticker ID [ON] symbol name
High/Low Price [ON] previous high and low
Bullish/Bearish Bias [ON] side with the higher Level 1 odds
Bullish/Bearish Percentage [ON] Level 1 odds for the high and the low
Frequency [Once Per Bar]
Once Per Bar fires on the first tick of each new bar
Once Per Bar Close fires when the bar closes
================================================================================
7. ALERTS — SETUP
================================================================================
1. Choose the message contents in 🔔 Alerts.
2. Right-click the chart → Add alert (or the alarm-clock icon).
3. Condition: CQ_Breakout Probability (Expo) → "Any alert() function call".
4. Create.
Example message:
BTCUSD
High Price: 101250 | Low Price: 99120
BIAS: BULLISH
Percentage: High: 63% | Low: 41%
Alerts fire only on real-time bars, and only after the statistics have at
least one comparable closed bar. If you change settings, delete and
recreate the alert so it uses the new configuration.
================================================================================
8. CHANGES FROM THE ORIGINAL SCRIPT
================================================================================
Accuracy
• The percentages are recalculated from the latest counts every time they
are drawn. The original only updated a level's value on bars where that
level was hit, so values went stale and read too high.
• No lookahead: statistics and the backtest use closed bars only, and the
bias is scored with the odds known at the bar's open.
• The step comes from the previous close, so levels no longer move with
the live price.
• The alert's High/Low percentages are now reported correctly for both
candle colors.
• No division by zero before any data exists; bars after a doji are not
scored.
Platform
• Converted from Pine Script v5 to v6.
• Drawings are built only on the last bar (faster loading).
• Higher label, line and box limits (500 each).
Features
• Level ladder extended from 5 to 7 levels per side.
• Every setting is exposed as an input, with detailed tooltips.
• Nearest-level highlight, gradient fade, and Extend Right 0–10 bars.
• Labels/Boxes Caption Mode, Side, Bar/Fine Spacing, Size, Hover Details,
and Remove Decimals.
• Expanded Statistics Panel (13 rows), off by default.
• Probability Pixel Dials (merged or separate) with themes, Auto Dim and
Night Palettes.
• Indicator Mode: Classic / Pixel Gauge / Classic + Pixel Gauge.
================================================================================
9. TIPS, LIMITATIONS AND TROUBLESHOOTING
================================================================================
• SAMPLE SIZE. Check "Sample (G / R)" in the panel or the tooltip. A few
dozen bars give noisy odds; several hundred or more are much steadier.
• STEP vs TIMEFRAME. On low timeframes a 1% step can push L2+ out of reach
(they show 0% or are hidden). Try 0.1–0.3% on intraday charts and 1–3% on
daily/weekly charts.
• 0% LEVELS HIDDEN. With "Disable 0.00%" ON, a pair disappears when either
side has never been reached. Turn it OFF to always see the full ladder.
• CAPTIONS OVERLAPPING CANDLES. Raise Bar Spacing, switch Side to Left, use
Boxes mode, or extend the lines and push the captions past them.
• DIAL LOOKS OVAL. Adjust Pixel Width against Pixel Height for your
monitor; use Dial Size to change the overall size.
• DIAL TEXT CUT OFF. Lower the tag or number sizes, or raise Dial Size.
• PANEL AND DIAL OVERLAP. Give them different Positions.
• BOX TOOLTIPS. Pine boxes cannot carry tooltips, so in Boxes mode an
invisible label sits on each box text to show the hover details.
• DIAL PRICES are rounded to whole numbers. On very low-priced symbols
(e.g. coins under 1.00) they will read 0 or 1.
• NOT A SIGNAL. A 70% level is still missed 3 times in 10. Combine with
structure, trend and risk management.
================================================================================
10. GLOSSARY
================================================================================
Level 1 The previous bar's high (upper) or low (lower).
Step Spacing between levels, in price.
Breakout The current bar trading at or above an upper level.
Breakdown The current bar trading at or below a lower level.
Odds /
Probability Historical share of comparable closed bars that reached
the level.
Comparable bar A closed bar that followed a candle of the same color as
the current previous candle.
Bias The side (high or low) with the higher Level 1 odds.
Net Edge Breakout odds − breakdown odds, in percentage points (the
merged dial's needle).
Doji A candle whose close equals its open.
Backtest
Profitability Share of bars where the bias side was reached; a hit rate,
not P&L.
--------------------------------------------------------------------------------
Original concept & method: Zeiierman — "Breakout Probability (Expo)"
CQ edition: CQuevedo345
License: CC BY-NC-SA 4.0 — non-commercial use, attribution required, share
alike.
--------------------------------------------------------------------------------
CQ_BREAKOUT PROBABILITY (EXPO) — USER MANUAL
TradingView Pine Script v6 Indicator
================================================================================
Original indicator : "Breakout Probability (Expo)" by Zeiierman
License : Creative Commons Attribution-NonCommercial-ShareAlike 4.0
(CC BY-NC-SA 4.0)
creativecommons.org/licenses/by-nc-sa/4.0/
This adaptation : CQ edition by CQuevedo345 — converted to Pine Script v6,
accuracy fixes, extended level ladder, highlight & fade,
Labels/Boxes captions, hover details, expanded
statistics panel and Probability Pixel Dials.
All credit for the original concept and core statistical method belongs to
Zeiierman. Under the CC BY-NC-SA 4.0 license, this adaptation may not be used
commercially, and any further adaptation must credit the original author and
be shared under the same license.
--------------------------------------------------------------------------------
TABLE OF CONTENTS
--------------------------------------------------------------------------------
1. What the indicator does
2. How the probabilities are calculated
3. Quick start
4. Reading the chart (Classic mode)
5. Reading the Probability Pixel Dial (Pixel Gauge mode)
6. Settings reference
6.1 📐 Levels
6.2 🎨 Lines & Fill
6.3 ✨ Highlight & Fade
6.4 🏷️ Labels
6.5 📊 Statistics Panel
6.6 🧭 Probability Pixel Dials — Layout
6.7 🎨 Probability Pixel Dials — Style
6.8 🌙 Probability Pixel Dials — Auto Dim
6.9 🔔 Alerts
7. Alerts — setup
8. Changes from the original script
9. Tips, limitations and troubleshooting
10. Glossary
================================================================================
1. WHAT THE INDICATOR DOES
================================================================================
Breakout Probability answers one question on every bar:
"Based on history, how likely is the CURRENT bar to trade above the
previous bar's high — or below the previous bar's low — and how likely
is it to reach levels farther out?"
It draws a ladder of price levels above the previous high and below the
previous low, and labels each one with the historical percentage of bars that
reached it. The statistics are counted separately for bars that follow a GREEN
candle and bars that follow a RED candle, because what the previous candle did
changes the odds.
On top of that the CQ edition adds:
• A Statistics Panel with the current bias, both Level 1 odds, the odds
after green and red candles, sample sizes and a bias backtest.
• A Probability Pixel Dial — a round 240° instrument gauge built from table
cells, in the same style as the other CQ pixel dials — showing breakout
and breakdown odds at a glance.
• Highlighting of the levels nearest to price, a gradient fade on the outer
levels, Labels or Boxes captions, and detailed hover tooltips.
The indicator works on any symbol and any timeframe. "Bar" always means a bar
of the chart timeframe you are on.
================================================================================
2. HOW THE PROBABILITIES ARE CALCULATED
================================================================================
THE LEVELS
For the current bar, the ladder is built from the PREVIOUS bar:
Upper Level 1 = previous high
Upper Level n = previous high + (n − 1) × Step
Lower Level 1 = previous low
Lower Level n = previous low − (n − 1) × Step
Step = previous close × Percentage Step %
Example — Percentage Step 1%, previous close 100,000, previous high 101,000,
previous low 99,000:
Upper L1 101,000 · L2 102,000 · L3 103,000 … L7 107,000
Lower L1 99,000 · L2 98,000 · L3 97,000 … L7 93,000
The step comes from the previous close, so the levels stay fixed for the
whole bar instead of drifting with the live price.
THE COUNTS
When each bar CLOSES, the script records:
• the color of the candle before it (green: close > open, red:
close < open),
• which upper levels the bar's high reached,
• which lower levels the bar's low reached.
The probability for a level is:
hits for that level after a candle of this color
───────────────────────────────────────────────── × 100
all closed bars that followed a candle of this color
The odds shown for the current bar use the statistics of the previous
candle's color. After a doji (open = close) the red statistics are shown,
and the doji bar itself is not counted.
NO LOOKAHEAD
Only CLOSED bars are counted. The bar that is still forming never changes the
statistics or the odds it is shown, and the backtest scores each bar using
only the odds that were known when that bar opened.
THE BIAS
The bias is the side whose Level 1 has the higher odds:
BULLISH — previous high more likely to be reached
BEARISH — previous low more likely to be reached
If the two are equal, the bias is BULLISH.
THE BACKTEST
At every bar close, the bias that was known at that bar's open is scored:
WIN — the bar reached the side the bias predicted
LOSS — it did not
Profitability = WIN ÷ (WIN + LOSS)
This is a hit rate of the bias, NOT a trading profit-and-loss figure. It
ignores entries, exits, stops, fees and the size of the move.
IMPORTANT
Every percentage is a historical frequency from the bars loaded on your
chart, not a prediction or a guarantee. Results differ between symbols,
timeframes and how much history is loaded. Use them as context, not as a
trading signal on their own.
================================================================================
3. QUICK START
================================================================================
1. Add the indicator to a chart. By default you get:
• 7 levels above the previous high and 7 below the previous low, each
with its probability label (Classic mode).
• A single merged Probability Pixel Dial at Middle Right
(Pixel Gauge mode).
• Indicator Mode = "Classic + Pixel Gauge" (both at once).
2. Hover any level label, or any tag row on the dial, for the full
explanation of that number.
3. Pick what you want to see under 📐 Levels → Indicator Mode.
4. Turn on 📊 Statistics Panel → Show Statistic Panel for the full statistics
and the bias backtest (off by default).
5. For alerts, see section 7.
Load as much history as practical. The more closed bars there are, the more
reliable the percentages. The panel's "Sample (G / R)" row and every tooltip
show how many bars each figure is based on.
================================================================================
4. READING THE CHART (CLASSIC MODE)
================================================================================
LEVEL LINES
• Upper color (green by default): levels above the previous high.
• Lower color (red by default): levels below the previous low.
• The pair closest to price — the nearest level above and the nearest level
below the current price — is HIGHLIGHTED: drawn thicker at full color.
Usually that is the previous high and low; after a breakout the highlight
moves to whichever levels now bracket price.
• Each level farther from price FADES step by step: line, label text and
background fill.
LABELS / BOXES
• Each level shows its probability, e.g. 63%.
• Caption Mode "Labels": floating text next to the line.
• Caption Mode "Boxes": a thin captioned box riding on the level line.
HOVER DETAILS (tooltip on every label or box)
▲ UPPER LEVEL 3 of 7
━━━━━━━━━━━━━━━━━━━━
Breakout probability: 18% (≈ 1 in 5.6)
Sample: reached on 94 of 524 closed bars that followed a GREEN candle.
Level price: 102,000
2 × 1% step above the previous high (+2,000).
Distance from current price: +1.84%
Current bar: ⏳ not reached yet
Opposite lower level at the same distance: 12%
Level 1 bias: BULLISH — prev high 63% vs prev low 41%
How to read it: …
The tooltip covers:
• the probability and its "1 in N" equivalent,
• the sample size behind it,
• how the level is built,
• its distance from the current price,
• whether the current bar has already reached it,
• the odds of the mirror level on the other side,
• the overall bias.
BACKGROUND FILL
Shaded bands between adjacent levels, in the upper / lower colors, fading
with the outer levels.
================================================================================
5. READING THE PROBABILITY PIXEL DIAL (PIXEL GAUGE MODE)
================================================================================
The dial is drawn from table cells (a 41 × 27 pixel grid per dial), pinned to
the screen, with the same face, needle, hub, themes and night lighting as the
other CQ pixel dials.
MERGED DIAL (default — "Merge Into Single Dial" ON)
50 50
100 ╭───── 0 ─────╮ 100
│ BREAKDOWN ▼ │ BREAKOUT ▲
│ (left) │ (right)
▼ NET ▲
• RIGHT half of the arc = BREAKOUT side (Upper color). Lit from the top out
to the odds of reaching the previous high.
• LEFT half of the arc = BREAKDOWN side (Lower color). Lit from the top out
to the odds of reaching the previous low.
• The scale reads 100 · 50 · 0 · 50 · 100: 0 at the top, 100% at each end.
• The NEEDLE points at the NET EDGE = breakout odds − breakdown odds.
Straight up → balanced
Toward right → breakout edge
Toward left → breakdown edge
• Zone dividers (notches) at 30 / 50 / 70 on each half, plus 0 at the top.
• Wedges: Leaning (50–70%) and Strong (70–100%), shaded on each half in that
side's color.
• Deeper-level ticks: bright marks on the arc at the odds of L2, L3 … on each
side, showing how quickly the odds drop past the previous high / low.
Tag rows:
Title B R E A K O U T P R O B A B I L I T Y
Levels ▼ prev low price distance % · ▲ prev high price distance %
Reading ▼ breakdown odds · breakout odds ▲
Zone BALANCED (edge within ±10 points)
BREAKOUT EDGE +n / BREAKDOWN EDGE −n
✅ HIGH BROKEN / ✅ LOW BROKEN / ✅ BOTH BROKEN
(the level was reached on the current bar)
The tag rows are colored by the side that has the edge. Hover any tag for the
net edge plus the full level-by-level breakout AND breakdown breakdown.
SEPARATE DIALS ("Merge Into Single Dial" OFF)
• BREAKOUT ▲ dial: the needle shows the odds of reaching the previous high.
The scale runs 0 → 100 left to right.
• BREAKDOWN ▼ dial: the same for the previous low.
• The zone tag on each dial reads:
LOW ODDS (< 30%)
BELOW EVEN (30–50%)
LEANING (50–70%)
STRONG ODDS (70%+)
✅ BROKEN (the level was reached on the current bar)
• "Dials" chooses Both, Breakout (High) only or Breakdown (Low) only.
NUMBER FORMAT ON THE DIAL
• Prices and price distances are always whole numbers (e.g. 101,250).
• Distance % shows two decimals.
• Odds follow "Remove Decimals from Percentages" (🏷️ Labels).
The dial is hidden until at least one comparable bar has closed.
================================================================================
6. SETTINGS REFERENCE
================================================================================
(Defaults in brackets. Every setting also has a tooltip in the settings
window.)
--------------------------------------------------------------------------------
6.1 📐 LEVELS
--------------------------------------------------------------------------------
Indicator Mode [Classic + Pixel Gauge]
Classic Level lines, labels/boxes, highlight & fade, fill.
Pixel Gauge Probability Pixel Dial(s) only; no lines on chart.
Classic + Pixel Gauge Both.
The Statistics Panel and alerts work in every mode.
Percentage Step [1.0]
Distance between levels as a % of the previous close. Smaller = tighter
levels with higher odds; larger = wider targets with lower odds. Changing
it recalculates all history.
Number of Lines [7] (1–7)
Levels drawn on each side. Statistics for all 7 are always calculated.
Disable 0.00% [ON]
Hides a level pair if either side has never been reached for the current
candle color. A level that rounds to "0%" but was reached at least once is
still shown.
--------------------------------------------------------------------------------
6.2 🎨 LINES & FILL
--------------------------------------------------------------------------------
Upper / Lower [green / red]
Colors of the levels above the previous high and below the previous low.
Also used for label text, fill, and the dial arcs.
Width / Style [2 / Solid] Solid · Dashed · Dotted
Line Length (bars back) [1] (1–500)
How far back from the current bar each line starts.
Extend Right (bars) [0] (0–10)
How far past the current bar the lines extend. Right-side captions move
out with the line end.
BG Color / Transparency [ON / 80]
Fill between adjacent levels; 0 = solid, 100 = invisible.
--------------------------------------------------------------------------------
6.3 ✨ HIGHLIGHT & FADE
--------------------------------------------------------------------------------
Highlight Nearest Levels / Width [ON / 4]
The nearest level above and below the current price are drawn thicker at
full color. Updates live.
Fade Outer Levels / Step / Max [ON / 20 / 80]
Each level beyond the highlighted ones is Step % fainter than the one
before (lines, labels, fill), up to Max %, so the outer levels stay
visible.
--------------------------------------------------------------------------------
6.4 🏷️ LABELS
--------------------------------------------------------------------------------
Show Labels [ON]
Bar Spacing [1] (−1 to 50)
Whole bars between the caption and the line end.
0 = touching
−1 = pulled one bar back, overlapping the line end
Right side counts from the end of the line; Left side counts from its
start.
Fine Spacing [0] (0–20)
Extra blank characters between the text and the line, for nudges smaller
than one bar. Labels mode only.
Hover Details [ON]
Detailed tooltip on every label / box (see section 4).
Remove Decimals from Percentages [ON]
Whole-number percentages (63%) in the labels, tooltips, panel, alerts and
dial odds. OFF = two decimals (62.84%). Display only; the calculations
always use exact values.
Side [Right] Right · Left
Right = after the current bar; Left = in front of the level lines.
Size [Normal] Tiny · Small · Normal · Large · Huge
Caption Mode [Labels] Labels · Boxes
Labels = floating text. Boxes = thin captioned box on the line itself,
with a light fill and a border in the level color.
Box Width / Height % [6 bars / 0.08% of price]
Size of each caption box (Boxes mode). Keep the height small so the box
stays thin.
--------------------------------------------------------------------------------
6.5 📊 STATISTICS PANEL
--------------------------------------------------------------------------------
Show Statistic Panel [OFF]
Position / Text [Top Right / Auto]
Win / Loss / Profitability colors [green / red / white]
Profitability uses chart text color [ON] adapts to light/dark themes
Frame / Width [gray 50% / 3] Width 0 removes the frame
Panel rows (hover any row for its explanation):
BREAKOUT PROBABILITY header
Prev Candle GREEN / RED / DOJI
Current Bias BULLISH ▲ / BEARISH ▼
Odds → Prev High Level 1 upside odds for the current setup
Odds → Prev Low Level 1 downside odds for the current setup
Bias This Bar ✅ Reached / ⏳ Pending
After GREEN (H / L) Level 1 high / low odds after green candles
After RED (H / L) Level 1 high / low odds after red candles
Sample (G / R) closed bars behind each set of statistics
Step Percentage Step and its price value
WIN / LOSS bias backtest counts
Profitability WIN ÷ (WIN + LOSS)
Bars Scored bars included in the backtest
Place the panel and the dial in different screen positions; two tables in
the same spot draw on top of each other.
--------------------------------------------------------------------------------
6.6 🧭 PROBABILITY PIXEL DIALS — LAYOUT
--------------------------------------------------------------------------------
Merge Into Single Dial [ON]
One combined dial (section 5). OFF = separate BREAKOUT / BREAKDOWN dials.
Dials [Both] Both · Breakout (High) · Breakdown (Low)
Separate-dial mode only.
Position [Middle Right]
Pixel Width / Height (% of chart) [0.15 / 0.3]
Size of one dial pixel. Adjust together until the dial looks round on
your screen (wide monitors need a smaller width than height).
Dial Size (×) [1.0] scales the whole dial without distorting it
Separation Between Dials [0 px] separate-dial mode
Left Padding [0 px] slides the dial(s) right
Scale Number Size [Tiny] scale numbers and the bottom caption
Needle Thickness [2] the hub grows with it
Title / Level / Reading / Zone Tag Size [Small / Tiny / Normal / Tiny]
--------------------------------------------------------------------------------
6.7 🎨 PROBABILITY PIXEL DIALS — STYLE
--------------------------------------------------------------------------------
Dial Color Theme [Aircraft Instrument]
Options: Custom, Beige VU Meter, Aircraft Instrument, Volkswagen Tacho,
Racing White Face, Amber Night, Marine Brass, Night Vision Green, Cockpit
Night, Illuminated Instrument. Custom uses the three color inputs below.
The arc always uses the Upper / Lower level colors (night gain/loss colors
while a Night Palette is active).
Dial Face Gradient / Bottom Opacity % [ON / 60]
Fades the face from top to bottom.
Dial Face / Scale Number / Needle Color Custom theme only
Unlit Arc Transparency [75] the part of the arc beyond the reading
Zone Dividers [ON] notches at 30 / 50 / 70
Odds Zone Wedges [ON]
Leaning 50–70 Opacity % [20] · Strong 70–100 % [40]
Deeper Level Ticks / color [ON / #00B0FF]
Marks the odds of L2, L3 … on the arc.
--------------------------------------------------------------------------------
6.8 🌙 PROBABILITY PIXEL DIALS — AUTO DIM
--------------------------------------------------------------------------------
(Same night-lighting system as the rest of the CQ pixel dials.)
Auto Dim Pixel Dials [ON]
Cuts the dial's opacity during the Dim Period. Applies only while the
Night Palette is Off.
Dim Amount % [50]
Dim Period [1900-0700] may cross midnight
Dim Timezone [America/Chicago] blank = exchange timezone
Night Palette [Cockpit Night]
Off opacity dimming only
Cockpit Night edge-lit incandescent panel: near-black face,
amber numerals, bright pointer, dimmed
annunciator green/red arcs, tag rows at 25%
opacity with text in the same color
Illuminated Instrument LED-backlit cluster: bright amber numerals,
orange-red pointer, cool-lit arcs, tag rows keep
their level color faded to 15% with brightened
text
Panel Rheostat % [85] night brightness, like a cockpit dimmer knob
Needle Halo (Night) [ON] faint glow around the needle and hub
The dimming uses the real clock, so it works on any timeframe. Pine only
redraws on incoming ticks, so the switch happens on the first tick after the
period starts or ends.
--------------------------------------------------------------------------------
6.9 🔔 ALERTS — ANY ALERT() FUNCTION CALL
--------------------------------------------------------------------------------
Ticker ID [ON] symbol name
High/Low Price [ON] previous high and low
Bullish/Bearish Bias [ON] side with the higher Level 1 odds
Bullish/Bearish Percentage [ON] Level 1 odds for the high and the low
Frequency [Once Per Bar]
Once Per Bar fires on the first tick of each new bar
Once Per Bar Close fires when the bar closes
================================================================================
7. ALERTS — SETUP
================================================================================
1. Choose the message contents in 🔔 Alerts.
2. Right-click the chart → Add alert (or the alarm-clock icon).
3. Condition: CQ_Breakout Probability (Expo) → "Any alert() function call".
4. Create.
Example message:
BTCUSD
High Price: 101250 | Low Price: 99120
BIAS: BULLISH
Percentage: High: 63% | Low: 41%
Alerts fire only on real-time bars, and only after the statistics have at
least one comparable closed bar. If you change settings, delete and
recreate the alert so it uses the new configuration.
================================================================================
8. CHANGES FROM THE ORIGINAL SCRIPT
================================================================================
Accuracy
• The percentages are recalculated from the latest counts every time they
are drawn. The original only updated a level's value on bars where that
level was hit, so values went stale and read too high.
• No lookahead: statistics and the backtest use closed bars only, and the
bias is scored with the odds known at the bar's open.
• The step comes from the previous close, so levels no longer move with
the live price.
• The alert's High/Low percentages are now reported correctly for both
candle colors.
• No division by zero before any data exists; bars after a doji are not
scored.
Platform
• Converted from Pine Script v5 to v6.
• Drawings are built only on the last bar (faster loading).
• Higher label, line and box limits (500 each).
Features
• Level ladder extended from 5 to 7 levels per side.
• Every setting is exposed as an input, with detailed tooltips.
• Nearest-level highlight, gradient fade, and Extend Right 0–10 bars.
• Labels/Boxes Caption Mode, Side, Bar/Fine Spacing, Size, Hover Details,
and Remove Decimals.
• Expanded Statistics Panel (13 rows), off by default.
• Probability Pixel Dials (merged or separate) with themes, Auto Dim and
Night Palettes.
• Indicator Mode: Classic / Pixel Gauge / Classic + Pixel Gauge.
================================================================================
9. TIPS, LIMITATIONS AND TROUBLESHOOTING
================================================================================
• SAMPLE SIZE. Check "Sample (G / R)" in the panel or the tooltip. A few
dozen bars give noisy odds; several hundred or more are much steadier.
• STEP vs TIMEFRAME. On low timeframes a 1% step can push L2+ out of reach
(they show 0% or are hidden). Try 0.1–0.3% on intraday charts and 1–3% on
daily/weekly charts.
• 0% LEVELS HIDDEN. With "Disable 0.00%" ON, a pair disappears when either
side has never been reached. Turn it OFF to always see the full ladder.
• CAPTIONS OVERLAPPING CANDLES. Raise Bar Spacing, switch Side to Left, use
Boxes mode, or extend the lines and push the captions past them.
• DIAL LOOKS OVAL. Adjust Pixel Width against Pixel Height for your
monitor; use Dial Size to change the overall size.
• DIAL TEXT CUT OFF. Lower the tag or number sizes, or raise Dial Size.
• PANEL AND DIAL OVERLAP. Give them different Positions.
• BOX TOOLTIPS. Pine boxes cannot carry tooltips, so in Boxes mode an
invisible label sits on each box text to show the hover details.
• DIAL PRICES are rounded to whole numbers. On very low-priced symbols
(e.g. coins under 1.00) they will read 0 or 1.
• NOT A SIGNAL. A 70% level is still missed 3 times in 10. Combine with
structure, trend and risk management.
================================================================================
10. GLOSSARY
================================================================================
Level 1 The previous bar's high (upper) or low (lower).
Step Spacing between levels, in price.
Breakout The current bar trading at or above an upper level.
Breakdown The current bar trading at or below a lower level.
Odds /
Probability Historical share of comparable closed bars that reached
the level.
Comparable bar A closed bar that followed a candle of the same color as
the current previous candle.
Bias The side (high or low) with the higher Level 1 odds.
Net Edge Breakout odds − breakdown odds, in percentage points (the
merged dial's needle).
Doji A candle whose close equals its open.
Backtest
Profitability Share of bars where the bias side was reached; a hit rate,
not P&L.
--------------------------------------------------------------------------------
Original concept & method: Zeiierman — "Breakout Probability (Expo)"
CQ edition: CQuevedo345
License: CC BY-NC-SA 4.0 — non-commercial use, attribution required, share
alike.
--------------------------------------------------------------------------------
Notas de Lançamento
The deeper level ticks now follow the direction: bright green on the breakout side and bright red on the breakdown side. Updated files: CQ_Breakout_Probability_Expo.pine and CQ_Breakout_Probability_Expo_User_Manual.txt. I haven’t compiled it, so tell me if the Pine Editor flags anything.Merged dial: ticks on the right half are green, ticks on the left half are red.
Separate dials: the BREAKOUT dial’s ticks are green and the BREAKDOWN dial’s are red.
Settings: the single tick color is now two pickers next to Deeper Level Ticks, ▲ (
#00FF66) and ▼ (
#FF1744), so you can still adjust either one.
At night: during the Dim Period the ticks use the Night Palette’s own green and red, brightened so they stand out from the arc.
Notas de Lançamento
There’s a new Dial Arrangement option in the 🧭 Probability Pixel Dials — Layout group: Side by Side (default) or Stacked. CQ_Breakout_Probability_Expo.pine has the change, and the manual is updated to match. I haven’t compiled it, so tell me if the Pine Editor flags anything.Side by Side works as before: BREAKOUT on the left, BREAKDOWN on the right.
Stacked puts BREAKOUT on top and BREAKDOWN underneath, each with its own tag rows.
Separation Between Dials sets the gap in both: blank columns side by side, blank rows when stacked. Left Padding also works in both.
When it applies: only with separate dials, so turn Merge Into Single Dial off and keep Dials on Both. The merged dial is a single dial, so it isn’t affected.
Notas de Lançamento
The Statistics Panel now shows its figures in two side-by-side columns, with the conclusion as one full-width row at the bottom. The script and the manual are both updated. I haven’t compiled it, so tell me if the Pine Editor flags anything.┌──────────────────────── BREAKOUT PROBABILITY ────────────────────────┐
│ Prev Candle GREEN │ Sample (G / R) 524 / 498 │
│ Current Bias BULLISH ▲ │ Step 1% (1,000) │
│ Odds → Prev High 63% │ WIN 612 │
│ Odds → Prev Low 41% │ LOSS 391 │
│ Bias This Bar ⏳ Pending │ Profitability 61% │
│ After GREEN (H/L) 63% / 41% │ Bars Scored 1003 │
│ After RED (H/L) 44% / 58% │ │
├──────────────────────────────────────────────────────────────────────┤
│ 📌 ESTIMATED CONCLUSION … │
└──────────────────────────────────────────────────────────────────────┘
Left column: the current setup — candle, bias, odds and the after-green / after-red odds.
Right column: sample size, step and the backtest. Its last slot is left blank.
The title and the conclusion each run across the full width.

Aviso legal
As informações e publicações não se destinam a ser, e não constituem, conselhos ou recomendações financeiras, de investimento, comerciais ou de outro tipo fornecidos ou endossados pela TradingView. Leia mais nos Termos de Uso.
Aviso legal
As informações e publicações não se destinam a ser, e não constituem, conselhos ou recomendações financeiras, de investimento, comerciais ou de outro tipo fornecidos ou endossados pela TradingView. Leia mais nos Termos de Uso.