Atualizado
Swing and Previous Day Levels with Labels
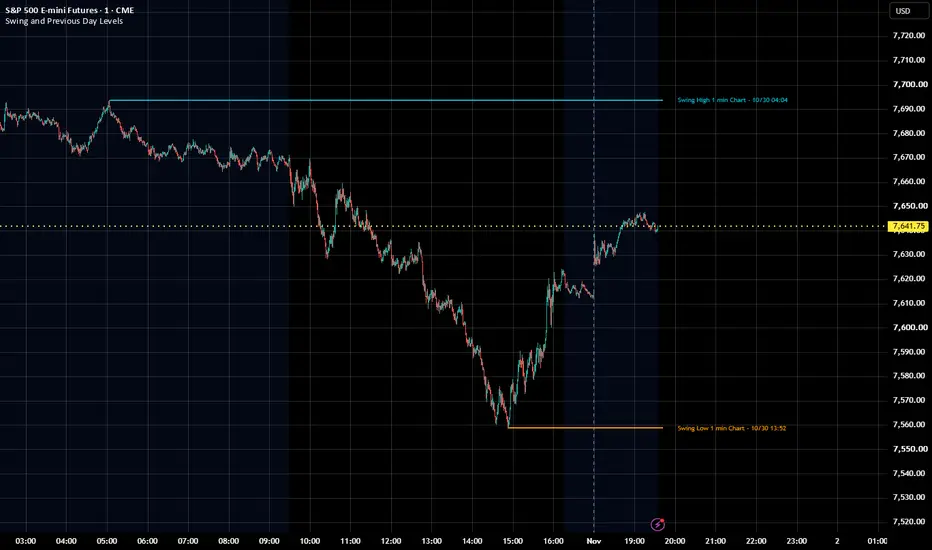
Keep important price levels visible with descriptive labels that identify what each level represents and when it originated.
This indicator combines six manually configured levels, automatic previous-day levels, and optional EMA reference levels from the 5-minute, 15-minute, and 60-minute timeframes.
FEATURES
• Six manual levels with independent visibility, color, label text, price, and start date/time.
• Automatic previous-day high, low, and close, each independently selectable.
• Optional EMA 20, 100, and 200 levels from each of three timeframes: 5 minutes, 15 minutes, and 60 minutes.
• Adjustable line width and solid, dashed, or dotted styling for manual and EMA levels. Previous-day levels use dashed lines.
• Adjustable line extension and label spacing.
• Optional timestamps identifying manual level start times and EMA source-bar closing times.
MANUAL LEVELS
Enter a price, select its start date/time, and give the level a descriptive label. These levels can mark swing highs and lows, support and resistance, or other prices you want to monitor.
Manual levels remain at the entered prices until you change their settings. Swing points are selected by the user; the indicator does not detect them automatically.
PREVIOUS-DAY LEVELS
Previous-day high, low, and close come from the symbol’s daily data feed. For futures, these values may differ from levels calculated using only regular trading hours.
CURRENT EMA LEVELS
EMA references are horizontal lines showing the value from the previous completed source-timeframe candle. They update as new source-timeframe periods begin and remain fixed while that source candle develops.
The “Start lines this many chart bars back” setting controls their displayed length. It does not select a historical EMA value or freeze the level.
When any EMA reference is enabled, use a time-based chart of 5 minutes or lower.
DISPLAY NOTES
Labels appear to the right of the latest chart bar. Allow sufficient space on the right side of the chart to display them.
Label timestamps use the symbol’s exchange timezone, which may differ from the chart’s selected timezone.
This indicator organizes reference levels for visual analysis. It does not generate trade signals.
Developed with assistance from ChatGPT.

This indicator combines six manually configured levels, automatic previous-day levels, and optional EMA reference levels from the 5-minute, 15-minute, and 60-minute timeframes.
FEATURES
• Six manual levels with independent visibility, color, label text, price, and start date/time.
• Automatic previous-day high, low, and close, each independently selectable.
• Optional EMA 20, 100, and 200 levels from each of three timeframes: 5 minutes, 15 minutes, and 60 minutes.
• Adjustable line width and solid, dashed, or dotted styling for manual and EMA levels. Previous-day levels use dashed lines.
• Adjustable line extension and label spacing.
• Optional timestamps identifying manual level start times and EMA source-bar closing times.
MANUAL LEVELS
Enter a price, select its start date/time, and give the level a descriptive label. These levels can mark swing highs and lows, support and resistance, or other prices you want to monitor.
Manual levels remain at the entered prices until you change their settings. Swing points are selected by the user; the indicator does not detect them automatically.
PREVIOUS-DAY LEVELS
Previous-day high, low, and close come from the symbol’s daily data feed. For futures, these values may differ from levels calculated using only regular trading hours.
CURRENT EMA LEVELS
EMA references are horizontal lines showing the value from the previous completed source-timeframe candle. They update as new source-timeframe periods begin and remain fixed while that source candle develops.
The “Start lines this many chart bars back” setting controls their displayed length. It does not select a historical EMA value or freeze the level.
When any EMA reference is enabled, use a time-based chart of 5 minutes or lower.
DISPLAY NOTES
Labels appear to the right of the latest chart bar. Allow sufficient space on the right side of the chart to display them.
Label timestamps use the symbol’s exchange timezone, which may differ from the chart’s selected timezone.
This indicator organizes reference levels for visual analysis. It does not generate trade signals.
Developed with assistance from ChatGPT.
Notas de Lançamento
Keep important price levels visible with descriptive labels that identify what each level represents and when it originatedThis indicator combines six manually configured levels, automatic previous-day levels, and optional EMA reference levels from the 5-minute, 15-minute, and 60-minute timeframes.
FEATURES
• Six manual levels with independent visibility, color, label text, price, and start date/time.
• Automatic previous-day high, low, and close, each independently selectable.
• Optional EMA 20, 100, and 200 levels from each of three timeframes: 5 minutes, 15 minutes, and 60 minutes.
• Adjustable line width and solid, dashed, or dotted styling for manual and EMA levels. Previous-day levels use dashed lines.
• Adjustable line extension and label spacing.
• Optional timestamps identifying manual level start times and EMA source-bar closing times.
MANUAL LEVELS
Enter a price, select its start date/time, and give the level a descriptive label. These levels can mark swing highs and lows, support and resistance, or other prices you want to monitor.
Manual levels remain at the entered prices until you change their settings. Swing points are selected by the user; the indicator does not detect them automatically.
PREVIOUS-DAY LEVELS
Previous-day high, low, and close come from the symbol’s daily data feed. For futures, these values may differ from levels calculated using only regular trading hours.
CURRENT EMA LEVELS
EMA references are horizontal lines showing the value from the previous completed source-timeframe candle. They update as new source-timeframe periods begin and remain fixed while that source candle develops.
The “Start lines this many chart bars back” setting controls their displayed length. It does not select a historical EMA value or freeze the level.
When any EMA reference is enabled, use a time-based chart of 5 minutes or lower.
DISPLAY NOTES
Labels appear to the right of the latest chart bar. Allow sufficient space on the right side of the chart to display them.
Label timestamps use the symbol’s exchange timezone, which may differ from the chart’s selected timezone.
This indicator organizes reference levels for visual analysis. It does not generate trade signals.
CHANGING A LEVEL’S START DATE AND TIME
Open the indicator’s Settings → Inputs.
Find the desired manual level, Level 1 through Level 6.
Under “Start date/time,” click the date field or calendar icon and select the desired date. You can also edit the date directly.
Set the time in the adjacent time field.
Enable “Show,” enter the level’s price and label, then click OK.
The line begins at the selected date/time and extends toward the latest chart bar. Choose a time within the chart’s loaded history to see its starting point.
The date/time input follows the chart’s selected timezone. Optional timestamps appended to labels use the symbol’s exchange timezone, so the displayed times may differ.
Developed with assistance from ChatGPT.

Aviso legal
As informações e publicações não se destinam a ser, e não constituem, conselhos ou recomendações financeiras, de investimento, comerciais ou de outro tipo fornecidos ou endossados pela TradingView. Leia mais nos Termos de Uso.
Aviso legal
As informações e publicações não se destinam a ser, e não constituem, conselhos ou recomendações financeiras, de investimento, comerciais ou de outro tipo fornecidos ou endossados pela TradingView. Leia mais nos Termos de Uso.