Atualizado
Martin Ratio Asset Screener [TrendAdvantage]
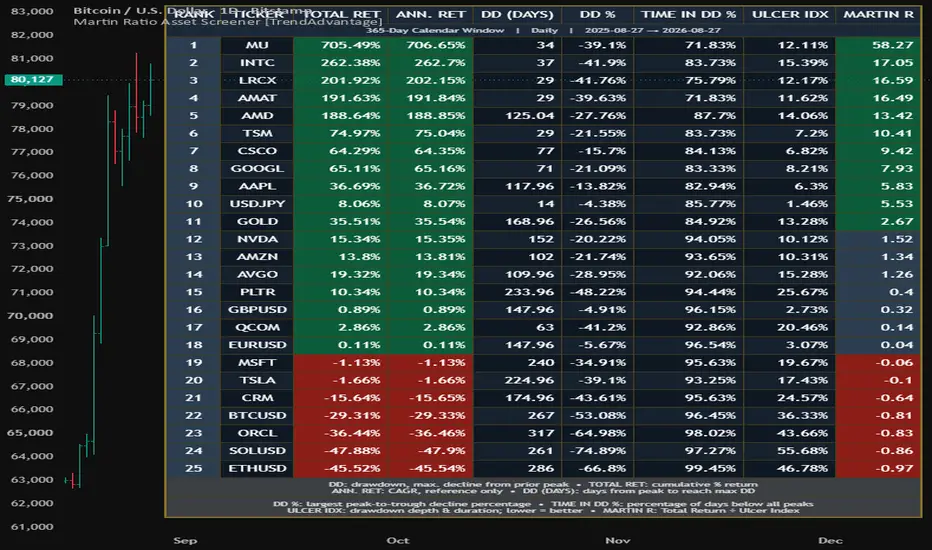
Martin Ratio Asset Screener
Advanced Downside & Recovery Profiler
تقييم الأصول وفقًا لنسبة مارتن
أداة متقدمة لتحليل الهبوط والتعافي
English documentation is followed by the Arabic translation below.
الشرح باللغة العربية متوفر في الجزء السفلي من هذه الصفحة
█ OVERVIEW
This screener is designed to compare multiple assets over an identical observation window. Martin Ratio values are intended for relative ranking within the selected universe rather than as universal standalone scores.
█ WHAT IS THE MARTIN RATIO?
The Martin Ratio is an advanced, risk-adjusted performance metric that evaluates an asset's return relative to both the magnitude and duration of its historical drawdowns. By utilizing the Ulcer Index (UI) as its risk proxy, it penalizes how deep an asset falls and how long it remains underwater.
It builds on the Ulcer Index, developed by Peter G. Martin and published together with Byron B. McCann in their 1989 book, "The Investor's Guide to Fidelity Funds". This indicator serves as a screening framework to identify assets that historically generated higher returns relative to their drawdown burden, rather than those that subject a portfolio to significant drawdowns, both in magnitude and duration.
█ WHY THE MARTIN RATIO IS DIFFERENT
Martin recognized a fundamental flaw in the Sharpe Ratio: it uses standard deviation as a proxy for risk, which penalizes all volatility equally — including sudden, sharp moves to the upside. For trend-following strategies or high-growth portfolios, an upward move artificially inflates standard deviation, making the strategy appear riskier than it actually is.
Unlike common risk-adjusted metrics that use standard deviation as a measure of risk, the Martin Ratio uses the Ulcer Index (UI) as its denominator. The Sortino Ratio addresses part of this problem by focusing only on downside volatility. However, downside volatility measures magnitude only, while drawdown has two components: magnitude and duration.
The Ulcer Index measures how far an asset falls below its previous highs and how persistently it remains below those highs. It therefore captures an important dimension of investment risk that conventional volatility measures can miss: the depth and persistence of capital drawdowns.
A portfolio that falls 10% and quickly recovers presents a very different investment from one that falls 10% and remains underwater for an extended period. Because the Ulcer Index is calculated from the sequence of drawdowns from prior peaks, prolonged drawdowns continue contributing to the measure until recovery occurs.
Significance of Drawdown Depth and Persistence
• Capital lock-up risk: Capital tied up in a prolonged drawdown cannot easily be
redeployed without realizing a loss.
• Behavioral risk: The deeper and longer a drawdown persists, the greater the
possibility that an investor abandons the position before recovery.
• Compounding drag: Time spent recovering previous losses is time during which
capital is not advancing beyond its former peak.
A higher Martin Ratio indicates that an asset generated more return per unit of historical drawdown burden over the selected period.
█ MATHEMATICAL FORMULA
The traditional Martin Ratio is expressed as:
`Martin Ratio = (Ra - Rf) / Ulcer Index`
Where:
• Ra: Annualized return of the portfolio, asset, or strategy.
• Rf: Risk-free rate of return.
• Ulcer Index: The root mean square of percentage drawdowns from previous
historical peaks. Lower Ulcer Index values indicate a shallower and/or less
persistent drawdown profile.
█ IMPLEMENTATION USED IN THIS SCREENER
The Martin Ratio shown by this screener uses total return over the selected lookback period rather than annualized return:
`Martin Ratio = Lookback Return / Ulcer Index`
The risk-free rate is also excluded. Because every ticker in the screener is evaluated using the same timeframe and identical lookback length, the resulting values can be used for direct comparison and ranking within the selected universe. This simplified implementation is designed primarily as a relative asset-ranking tool, rather than as a reproduction of the traditional annualized Martin Ratio.
█ HOW THE SCREENER COMPARES ASSETS
Comparison between assets follows a consistent four-step framework:
1 — Use an Identical Lookback Window — All selected tickers are evaluated
using the same timeframe and lookback length in days. This is essential for
meaningful comparison because changing either parameter changes the return
horizon and the drawdown history being measured.
2 — Calculate Lookback Return — The total buy-and-hold return is
calculated for each ticker over the selected lookback period.
3 — Calculate the Ulcer Index — For each ticker, the script identifies
the running historical peak within the calculation sequence, measures each
closing price's percentage drawdown from that peak, squares those values,
averages them, and takes the square root. The result is the ticker's Ulcer
Index over the selected period.
4 — Calculate and Rank the Martin Ratio — The lookback return is divided
by the ticker's Ulcer Index. Higher values indicate a more favorable
combination of return and drawdown over the selected measurement period.
█ OPERATIONAL NOTES
The lookback period should be sufficiently long to capture a meaningful range of market conditions, such as a drawdown and recovery. Very short windows can produce unstable or misleading ratios, particularly when an asset has experienced little or no meaningful drawdown.
As a general starting point:
• Minimum: approximately 180 calendar days (~6 months)
• Preferred: 365 calendar days (1 year) or more
These are practical guidelines rather than statistically derived minimums. The appropriate lookback depends on the asset and intended investment horizon. Lookback periods spanning several years or more may exceed the available historical data for some tickers — particularly recently listed assets — resulting in N/A values.
This screener computes each ticker's metrics over an identical calendar-day window — not a fixed bar count — so a given lookback (e.g., 300 days) covers the same 300 calendar days for equities, cryptocurrencies, or forex alike, regardless of how many bars each one produces in that span on a given timeframe. This makes lookback settings directly comparable across asset classes, independent of the chart's timeframe.
One dependency remains: the host chart being viewed governs when the screener's internal calculation updates. If the host chart is a restricted-session equity (or similar), tickers from continuously-traded markets like crypto may not accumulate enough calendar history to populate, and can show N/A even within a supported lookback window. When mixing asset classes in the same table, view the screener from a crypto or forex chart to ensure prices are populated across all assets.
█ MARTIN RATIO THRESHOLD
The threshold used by the screener is a visual ranking aid, not a statistically validated cutoff. Table colors are interpreted as follows:
• Above threshold: Green
• Between 0 and the threshold: Grey
• Below 0: Red
The threshold is intended solely as a visual aid for ranking assets rather than a universal definition of a "good" Martin Ratio. Martin Ratio values are most meaningful when comparing securities calculated using the same methodology, timeframe, and lookback period. Because the implementation used here is based on non-annualized lookback returns, values should not be treated as universal absolute benchmarks across different timeframe and lookback configurations. For practical use, the threshold can be calibrated to the characteristics of the user's own watch list or investment universe.
█ INTERPRETATION
Each ticker's row includes the following metrics:
• Total Return — Cumulative percentage return over the selected
lookback period.
• Ann. Ret — Annualized return (CAGR) over the same period, shown for
reference only; it does not influence the Martin Ratio or the ranking.
• DD (Days) — The number of calendar days from peak to trough of the
single largest (deepest) drawdown observed in the window.
• DD % — The magnitude of largest drawdown, expressed as a percentage
decline from its prior peak.
• Time in DD % — The percentage of calendar days across the entire
lookback window during which the asset was trading below its prior peaks, in
any drawdown — not limited to the single largest one.
• Ulcer Index — A measure of drawdown depth and duration combined,
calculated as the root-mean-square of percentage drawdowns across every day
in the window. Unlike DD %, which reflects only the single worst decline, the
Ulcer Index captures the cumulative "pain" of all drawdowns the asset
experienced — larger and more persistent drawdowns increase the Ulcer Index.
• Martin Ratio — Total Return divided by the Ulcer Index, measuring
return earned per unit of drawdown intensity.
Within an identically configured comparison:
• Higher Martin Ratio → More return relative to the historical drawdown
burden.
• Lower positive Martin Ratio → Positive return, but with a less favorable
drawdown profile.
• Negative Martin Ratio → Negative return over the selected lookback period.
The screener is therefore best used as a cross-sectional ranking tool for identifying which assets have delivered the strongest return relative to the depth and persistence of their drawdowns over the same observation window.
█ DISCLAIMER
This script is published for educational and informational purposes only and does not constitute financial or investment advice. The Martin Ratio relies entirely on historical price data; past drawdown depth, duration, and recovery speed are not indicative of future results. Always conduct your own research and practice proper risk management before making investment decisions.
═════════════════════════════════════════════════════════════
الشرح باللغة العربية
هذا التطبيق مصمم لمقارنة أصول متعددة عبر فترة حساب متطابقة. يُقصد بقيم نسبة مارتن أن تُستخدم للترتيب النسبي داخل مجموعة الأصول المختارة، وليس كقيم مطلقة قائمة بذاتها
█ ما هي نسبة مارتن؟
نسبة مارتن هي مقياس متقدم للأداء، يقيّم عائد الأصول المالية مقارنةً بكلٍ من حجم ومدة تراجعاتها التاريخية. ومن خلال استخدام مؤشر شدة التراجع كمقياس للمخاطر، فإنها تأخذ في الاعتبار مدى عمق هبوط الأصول المالية وطول الفترة التي تظل فيها دون قممها السابقة
تعتمد نسبة مارتن على مؤشر شدة التراجع، الذي طوّره بيتر ج. مارتن ونُشر بالاشتراك مع بايرون ب. ماكان في كتابهما الصادر عام 1989، "دليل المستثمر إلى صناديق فيديليتي". ويعمل هذا المؤشر كإطار لفحص الأصول بهدف تحديد الأصول الأكثر مرونة وقدرةً على تنمية رأس المال بكفاءة، بدلاً من الأصول التي تعرّض المحفظة لتراجعات كبيرة من حيث الحجم والمدة
█ لماذا تختلف نسبة مارتن؟
أدرك مارتن وجود عيب جوهري في نسبة شارب، إذ تستخدم الانحراف المعياري كمقياس للمخاطر، وهو ما يعامل جميع أنواع التقلبات بنفس الأسلوب بما في ذلك التحركات الصعودية المفاجئة والحادة. وفي استراتيجيات تتبع الاتجاه أو المحافظ مرتفعة النمو، قد تؤدي الحركة الصعودية إلى رفع الانحراف المعياري بشكل مصطنع، مما يجعل الاستراتيجية تبدو أكثر خطورة مما هي عليه فعلياً
وعلى خلاف المقاييس الشائعة التي تستخدم الانحراف المعياري لقياس المخاطر، تستخدم نسبة مارتن مؤشر شدة التراجع في المقام. وتُعالج نسبة سورتينو جزءاً من هذه المشكلة من خلال التركيز فقط على تقلبات الجانب السلبي، إلا أن تقلبات الجانب السلبي تقيس حجم التقلبات فقط، بينما يتكون التراجع من عنصرين: الحجم والمدة
يقيس مؤشر شدة التراجع مدى هبوط الأصول المالية عن قممها السابقة ومدى استمرارها دون تلك القمم. ولذلك فهو يلتقط بُعداً مهماً من مخاطر الاستثمار قد لا تعكسه مقاييس التقلب التقليدية، وهو حجم تراجعات رأس المال ومدة الفترة الزمنية للتراجعات
وتختلف المحفظة التي تهبط بنسبة 10% ثم تتعافى سريعاً اختلافاً جوهرياً عن محفظة تهبط بالنسبة نفسها وتظل دون قمتها السابقة لفترة ممتدة. وبما أن مؤشر شدة التراجع يُحسب من تسلسل التراجعات عن القمم السابقة، فإن التراجعات الممتدة تواصل التأثير في قيمة المؤشر حتى حدوث التعافي
أهمية عمق التراجع واستمراره
• مخاطر تجميد رأس المال: يصعب إعادة توظيف رأس المال العالق في تراجع ممتد دون تحقيق خسارة فعلية
• المخاطر السلوكية: كلما كان التراجع أعمق وأطول، زادت احتمالية تخلي المستثمر عن المركز قبل حدوث التعافي
• عبء التعافي على النمو المركب: الوقت المستغرق في تعويض الخسائر السابقة هو وقت لا يتجاوز فيه رأس المال قمته السابقة، أي تمتد فترة طويلة قبل تحقيق الأرباح الفعلية
تشير نسبة مارتن المرتفعة إلى أن الأصل حقق عائداً أكبر مقابل كل وحدة من عبء التراجع التاريخي خلال الفترة المحددة
█ الصيغة الرياضية
تحسب نسبة مارتن التقليدية كالتالي
نسبة مارتن = (العائد السنوي − العائد الخالي من المخاطر) ÷ مؤشر شدة التراجع
حيث
مؤشر شدة التراجع: الجذر التربيعي لمتوسط مربعات نسب التراجع عن القمم التاريخية السابقة. وتشير القيم الأقل للمؤشر إلى تراجعات أقل عمقاً و/أو أقصر استمراراً
█ حساب نسبة مارتن في التطبيق المستخدم الحالي
تستخدم نسبة مارتن المعروضة في هذا التطبيق إجمالي العائد خلال فترة الحساب المحددة بدلاً من العائد السنوي
`نسبة مارتن = عائد فترة الحساب ÷ مؤشر شدة التراجع`
كما يتم استبعاد معدل العائد الخالي من المخاطر. ونظراً إلى أن كل رمز في التطبيق يُقيَّم باستخدام الإطار الزمني (تايم فريم) نفسه وطول فترة الحساب نفسها، يمكن استخدام القيم الناتجة للمقارنة المباشرة والترتيب داخل مجموعة الأصول المختارة. صُمم هذا التطبيق المبسط أساساً كأداة للتصنيف النسبي للأصول، وليس كإعادة حساب لنسبة مارتن التقليدية المحسوبة على أساس سنوي
█ كيف تقارن أداة التقييم بين الأصول
تتبع المقارنة بين الأصول إطاراً ثابتاً من أربع خطوات
█ ملاحظات الاستخدام
ينبغي أن تكون فترة الحساب طويلة بما يكفي لتغطية فترة ذات دلالة من ظروف السوق، مثل فترة تراجع وتعافٍ لاحق. فترات الحساب القصيرة جدًا قد تُنتج نسبًا غير مستقرة أو مضللة، خاصة عندما لا يكون الأصل قد شهد تراجعًا ذا دلالة
كنقطة بداية عامة
• الحد الأدنى: نحو 180 يومًا تقويميًا (حوالي 6 أشهر)
• المُفضَّل: 365 يومًا تقويميًا (سنة واحدة) أو أكثر
هذه إرشادات عملية وليست حدودًا دنيا مُشتقة إحصائيًا. تعتمد فترة الحساب المناسبة على فئة الأصل والأفق الاستثماري المقصود. قد تتجاوز فترات الحساب الممتدة لعدة سنوات أو أكثر البيانات التاريخية المتاحة لبعض الرموز — خاصة الأصول المُدرجة حديثًا — مما يؤدي إلى ظهور قيم غير متاح
يحسب هذا التطبيق مقاييس كل رمز عبر فترة حساب متطابقة من الأيام التقويمية — وليس عددًا ثابتًا من الشموع — بحيث تغطي فترة حساب معينة (مثل 300 يوم) نفس الـ300 يوم التقويمي سواء للسهم أو للعملة الرقمية أو للعملات الفوركس، بصرف النظر عن عدد الشموع التي يُنتجها كل منها خلال تلك الفترة على أي إطار زمني معين. وهذا يجعل إعدادات فترة الحساب قابلة للمقارنة مباشرة عبر فئات الأصول المختلفة، بمعزل عن الإطار الزمني للرسم البياني
يبقى اعتماد واحد قائمًا: الرسم البياني المعروض الذي تُشاهد الجدول من خلاله هو ما يحدد توقيت تحديث الحساب الداخلي للتطبيق. فإذا كان الرسم البياني لسهم ذي جلسات تداول محدودة (أو ما شابه)، فقد لا تتمكن الرموز من أسواق مستمرة التداول مثل العملات الرقمية من تجميع سجل تقويمي كافٍ، وقد تظهر بقيمة "غير متاح" حتى ضمن فترة حساب مدعومة. عند الجمع بين فئات أصول مختلفة في الجدول نفسه، يُنصح بمشاهدة الجدول من رسم بياني لعملة رقمية أو فوركس لتجنب هذه المشكلة
█ الحد المرجعي لنسبة مارتن
حد اللون الأخضر لنسبة مارتن المستخدم في التطبيق هو وسيلة بصرية للمساعدة في الترتيب، وليس حداً فاصلاً مثبتاً إحصائياً. تُفسَّر ألوان الجدول على النحو التالي
• أعلى من الحد: أخضر
• بين الصفر والحد: رمادي
• أقل من الصفر: أحمر
ينبغي التعامل مع الحد باعتباره مستوى مرجعياً قابلاً للتعديل، وليس تعريفاً عاماً لما يُعد نسبة مارتن جيدة. تكون قيم نسبة مارتن أكثر دلالة عند مقارنة أوراق مالية حُسبت باستخدام المنهجية والإطار الزمني وفترة الحساب نفسها. ونظراً إلى أن التطبيق المستخدم هنا يعتمد على عوائد فترة الحساب غير محسوبة على أساس سنوي، فلا ينبغي اعتبار القيم معايير مطلقة عامة عبر إعدادات مختلفة للأطر الزمنية وفترات الحساب. للاستخدام العملي، يمكن معايرة الحد بما يتناسب مع خصائص الأصول المالية المرصودة أو مجموعة الأصول الاستثمارية الخاصة بالمستخدم
█ تفسير نسبة مارتن
يتضمن الجدول المقاييس التالية لكل رمز
ضمن مقارنة بإعدادات متطابقة
• نسبة مارتن الأعلى ← عائد أكبر مقارنةً بعبء التراجع التاريخي
• نسبة مارتن الموجبة المنخفضة ← عائد موجب، لكن مع ملف تراجع أقل ملاءمة
• نسبة مارتن السالبة ← عائد سالب خلال فترة الحساب المحددة
لذا، يُعد هذا التطبيق أداة مثالية للترتيب المقطعي لتحديد الأصول التي حققت أقوى عائد مقارنةً بعمق وديمومة تراجعاتها خلال نفس فترة الحساب
█ إخلاء المسؤولية
يُنشر هذا السكربت لأغراض تعليمية ومعلوماتية فقط، ولا يُعد نصيحة مالية أو استثمارية. تعتمد نسبة مارتن بالكامل على بيانات الأسعار التاريخية، ولا يُعد عمق التراجع أو مدته أو سرعة التعافي في الماضي مؤشراً على النتائج المستقبلية. احرص دائماً على إجراء أبحاثك الخاصة وتطبيق إدارة سليمة للمخاطر قبل اتخاذ أي قرارات استثمارية
Advanced Downside & Recovery Profiler
تقييم الأصول وفقًا لنسبة مارتن
أداة متقدمة لتحليل الهبوط والتعافي
English documentation is followed by the Arabic translation below.
الشرح باللغة العربية متوفر في الجزء السفلي من هذه الصفحة
█ OVERVIEW
This screener is designed to compare multiple assets over an identical observation window. Martin Ratio values are intended for relative ranking within the selected universe rather than as universal standalone scores.
█ WHAT IS THE MARTIN RATIO?
The Martin Ratio is an advanced, risk-adjusted performance metric that evaluates an asset's return relative to both the magnitude and duration of its historical drawdowns. By utilizing the Ulcer Index (UI) as its risk proxy, it penalizes how deep an asset falls and how long it remains underwater.
It builds on the Ulcer Index, developed by Peter G. Martin and published together with Byron B. McCann in their 1989 book, "The Investor's Guide to Fidelity Funds". This indicator serves as a screening framework to identify assets that historically generated higher returns relative to their drawdown burden, rather than those that subject a portfolio to significant drawdowns, both in magnitude and duration.
█ WHY THE MARTIN RATIO IS DIFFERENT
Martin recognized a fundamental flaw in the Sharpe Ratio: it uses standard deviation as a proxy for risk, which penalizes all volatility equally — including sudden, sharp moves to the upside. For trend-following strategies or high-growth portfolios, an upward move artificially inflates standard deviation, making the strategy appear riskier than it actually is.
Unlike common risk-adjusted metrics that use standard deviation as a measure of risk, the Martin Ratio uses the Ulcer Index (UI) as its denominator. The Sortino Ratio addresses part of this problem by focusing only on downside volatility. However, downside volatility measures magnitude only, while drawdown has two components: magnitude and duration.
The Ulcer Index measures how far an asset falls below its previous highs and how persistently it remains below those highs. It therefore captures an important dimension of investment risk that conventional volatility measures can miss: the depth and persistence of capital drawdowns.
A portfolio that falls 10% and quickly recovers presents a very different investment from one that falls 10% and remains underwater for an extended period. Because the Ulcer Index is calculated from the sequence of drawdowns from prior peaks, prolonged drawdowns continue contributing to the measure until recovery occurs.
Significance of Drawdown Depth and Persistence
• Capital lock-up risk: Capital tied up in a prolonged drawdown cannot easily be
redeployed without realizing a loss.
• Behavioral risk: The deeper and longer a drawdown persists, the greater the
possibility that an investor abandons the position before recovery.
• Compounding drag: Time spent recovering previous losses is time during which
capital is not advancing beyond its former peak.
A higher Martin Ratio indicates that an asset generated more return per unit of historical drawdown burden over the selected period.
█ MATHEMATICAL FORMULA
The traditional Martin Ratio is expressed as:
`Martin Ratio = (Ra - Rf) / Ulcer Index`
Where:
• Ra: Annualized return of the portfolio, asset, or strategy.
• Rf: Risk-free rate of return.
• Ulcer Index: The root mean square of percentage drawdowns from previous
historical peaks. Lower Ulcer Index values indicate a shallower and/or less
persistent drawdown profile.
█ IMPLEMENTATION USED IN THIS SCREENER
The Martin Ratio shown by this screener uses total return over the selected lookback period rather than annualized return:
`Martin Ratio = Lookback Return / Ulcer Index`
The risk-free rate is also excluded. Because every ticker in the screener is evaluated using the same timeframe and identical lookback length, the resulting values can be used for direct comparison and ranking within the selected universe. This simplified implementation is designed primarily as a relative asset-ranking tool, rather than as a reproduction of the traditional annualized Martin Ratio.
█ HOW THE SCREENER COMPARES ASSETS
Comparison between assets follows a consistent four-step framework:
1 — Use an Identical Lookback Window — All selected tickers are evaluated
using the same timeframe and lookback length in days. This is essential for
meaningful comparison because changing either parameter changes the return
horizon and the drawdown history being measured.
2 — Calculate Lookback Return — The total buy-and-hold return is
calculated for each ticker over the selected lookback period.
3 — Calculate the Ulcer Index — For each ticker, the script identifies
the running historical peak within the calculation sequence, measures each
closing price's percentage drawdown from that peak, squares those values,
averages them, and takes the square root. The result is the ticker's Ulcer
Index over the selected period.
4 — Calculate and Rank the Martin Ratio — The lookback return is divided
by the ticker's Ulcer Index. Higher values indicate a more favorable
combination of return and drawdown over the selected measurement period.
█ OPERATIONAL NOTES
The lookback period should be sufficiently long to capture a meaningful range of market conditions, such as a drawdown and recovery. Very short windows can produce unstable or misleading ratios, particularly when an asset has experienced little or no meaningful drawdown.
As a general starting point:
• Minimum: approximately 180 calendar days (~6 months)
• Preferred: 365 calendar days (1 year) or more
These are practical guidelines rather than statistically derived minimums. The appropriate lookback depends on the asset and intended investment horizon. Lookback periods spanning several years or more may exceed the available historical data for some tickers — particularly recently listed assets — resulting in N/A values.
This screener computes each ticker's metrics over an identical calendar-day window — not a fixed bar count — so a given lookback (e.g., 300 days) covers the same 300 calendar days for equities, cryptocurrencies, or forex alike, regardless of how many bars each one produces in that span on a given timeframe. This makes lookback settings directly comparable across asset classes, independent of the chart's timeframe.
One dependency remains: the host chart being viewed governs when the screener's internal calculation updates. If the host chart is a restricted-session equity (or similar), tickers from continuously-traded markets like crypto may not accumulate enough calendar history to populate, and can show N/A even within a supported lookback window. When mixing asset classes in the same table, view the screener from a crypto or forex chart to ensure prices are populated across all assets.
█ MARTIN RATIO THRESHOLD
The threshold used by the screener is a visual ranking aid, not a statistically validated cutoff. Table colors are interpreted as follows:
• Above threshold: Green
• Between 0 and the threshold: Grey
• Below 0: Red
The threshold is intended solely as a visual aid for ranking assets rather than a universal definition of a "good" Martin Ratio. Martin Ratio values are most meaningful when comparing securities calculated using the same methodology, timeframe, and lookback period. Because the implementation used here is based on non-annualized lookback returns, values should not be treated as universal absolute benchmarks across different timeframe and lookback configurations. For practical use, the threshold can be calibrated to the characteristics of the user's own watch list or investment universe.
█ INTERPRETATION
Each ticker's row includes the following metrics:
• Total Return — Cumulative percentage return over the selected
lookback period.
• Ann. Ret — Annualized return (CAGR) over the same period, shown for
reference only; it does not influence the Martin Ratio or the ranking.
• DD (Days) — The number of calendar days from peak to trough of the
single largest (deepest) drawdown observed in the window.
• DD % — The magnitude of largest drawdown, expressed as a percentage
decline from its prior peak.
• Time in DD % — The percentage of calendar days across the entire
lookback window during which the asset was trading below its prior peaks, in
any drawdown — not limited to the single largest one.
• Ulcer Index — A measure of drawdown depth and duration combined,
calculated as the root-mean-square of percentage drawdowns across every day
in the window. Unlike DD %, which reflects only the single worst decline, the
Ulcer Index captures the cumulative "pain" of all drawdowns the asset
experienced — larger and more persistent drawdowns increase the Ulcer Index.
• Martin Ratio — Total Return divided by the Ulcer Index, measuring
return earned per unit of drawdown intensity.
Within an identically configured comparison:
• Higher Martin Ratio → More return relative to the historical drawdown
burden.
• Lower positive Martin Ratio → Positive return, but with a less favorable
drawdown profile.
• Negative Martin Ratio → Negative return over the selected lookback period.
The screener is therefore best used as a cross-sectional ranking tool for identifying which assets have delivered the strongest return relative to the depth and persistence of their drawdowns over the same observation window.
█ DISCLAIMER
This script is published for educational and informational purposes only and does not constitute financial or investment advice. The Martin Ratio relies entirely on historical price data; past drawdown depth, duration, and recovery speed are not indicative of future results. Always conduct your own research and practice proper risk management before making investment decisions.
═════════════════════════════════════════════════════════════
الشرح باللغة العربية
هذا التطبيق مصمم لمقارنة أصول متعددة عبر فترة حساب متطابقة. يُقصد بقيم نسبة مارتن أن تُستخدم للترتيب النسبي داخل مجموعة الأصول المختارة، وليس كقيم مطلقة قائمة بذاتها
█ ما هي نسبة مارتن؟
نسبة مارتن هي مقياس متقدم للأداء، يقيّم عائد الأصول المالية مقارنةً بكلٍ من حجم ومدة تراجعاتها التاريخية. ومن خلال استخدام مؤشر شدة التراجع كمقياس للمخاطر، فإنها تأخذ في الاعتبار مدى عمق هبوط الأصول المالية وطول الفترة التي تظل فيها دون قممها السابقة
تعتمد نسبة مارتن على مؤشر شدة التراجع، الذي طوّره بيتر ج. مارتن ونُشر بالاشتراك مع بايرون ب. ماكان في كتابهما الصادر عام 1989، "دليل المستثمر إلى صناديق فيديليتي". ويعمل هذا المؤشر كإطار لفحص الأصول بهدف تحديد الأصول الأكثر مرونة وقدرةً على تنمية رأس المال بكفاءة، بدلاً من الأصول التي تعرّض المحفظة لتراجعات كبيرة من حيث الحجم والمدة
█ لماذا تختلف نسبة مارتن؟
أدرك مارتن وجود عيب جوهري في نسبة شارب، إذ تستخدم الانحراف المعياري كمقياس للمخاطر، وهو ما يعامل جميع أنواع التقلبات بنفس الأسلوب بما في ذلك التحركات الصعودية المفاجئة والحادة. وفي استراتيجيات تتبع الاتجاه أو المحافظ مرتفعة النمو، قد تؤدي الحركة الصعودية إلى رفع الانحراف المعياري بشكل مصطنع، مما يجعل الاستراتيجية تبدو أكثر خطورة مما هي عليه فعلياً
وعلى خلاف المقاييس الشائعة التي تستخدم الانحراف المعياري لقياس المخاطر، تستخدم نسبة مارتن مؤشر شدة التراجع في المقام. وتُعالج نسبة سورتينو جزءاً من هذه المشكلة من خلال التركيز فقط على تقلبات الجانب السلبي، إلا أن تقلبات الجانب السلبي تقيس حجم التقلبات فقط، بينما يتكون التراجع من عنصرين: الحجم والمدة
يقيس مؤشر شدة التراجع مدى هبوط الأصول المالية عن قممها السابقة ومدى استمرارها دون تلك القمم. ولذلك فهو يلتقط بُعداً مهماً من مخاطر الاستثمار قد لا تعكسه مقاييس التقلب التقليدية، وهو حجم تراجعات رأس المال ومدة الفترة الزمنية للتراجعات
وتختلف المحفظة التي تهبط بنسبة 10% ثم تتعافى سريعاً اختلافاً جوهرياً عن محفظة تهبط بالنسبة نفسها وتظل دون قمتها السابقة لفترة ممتدة. وبما أن مؤشر شدة التراجع يُحسب من تسلسل التراجعات عن القمم السابقة، فإن التراجعات الممتدة تواصل التأثير في قيمة المؤشر حتى حدوث التعافي
أهمية عمق التراجع واستمراره
• مخاطر تجميد رأس المال: يصعب إعادة توظيف رأس المال العالق في تراجع ممتد دون تحقيق خسارة فعلية
• المخاطر السلوكية: كلما كان التراجع أعمق وأطول، زادت احتمالية تخلي المستثمر عن المركز قبل حدوث التعافي
• عبء التعافي على النمو المركب: الوقت المستغرق في تعويض الخسائر السابقة هو وقت لا يتجاوز فيه رأس المال قمته السابقة، أي تمتد فترة طويلة قبل تحقيق الأرباح الفعلية
تشير نسبة مارتن المرتفعة إلى أن الأصل حقق عائداً أكبر مقابل كل وحدة من عبء التراجع التاريخي خلال الفترة المحددة
█ الصيغة الرياضية
تحسب نسبة مارتن التقليدية كالتالي
نسبة مارتن = (العائد السنوي − العائد الخالي من المخاطر) ÷ مؤشر شدة التراجع
حيث
مؤشر شدة التراجع: الجذر التربيعي لمتوسط مربعات نسب التراجع عن القمم التاريخية السابقة. وتشير القيم الأقل للمؤشر إلى تراجعات أقل عمقاً و/أو أقصر استمراراً
█ حساب نسبة مارتن في التطبيق المستخدم الحالي
تستخدم نسبة مارتن المعروضة في هذا التطبيق إجمالي العائد خلال فترة الحساب المحددة بدلاً من العائد السنوي
`نسبة مارتن = عائد فترة الحساب ÷ مؤشر شدة التراجع`
كما يتم استبعاد معدل العائد الخالي من المخاطر. ونظراً إلى أن كل رمز في التطبيق يُقيَّم باستخدام الإطار الزمني (تايم فريم) نفسه وطول فترة الحساب نفسها، يمكن استخدام القيم الناتجة للمقارنة المباشرة والترتيب داخل مجموعة الأصول المختارة. صُمم هذا التطبيق المبسط أساساً كأداة للتصنيف النسبي للأصول، وليس كإعادة حساب لنسبة مارتن التقليدية المحسوبة على أساس سنوي
█ كيف تقارن أداة التقييم بين الأصول
تتبع المقارنة بين الأصول إطاراً ثابتاً من أربع خطوات
- استخدام فترة حساب متطابقة — تُقيَّم جميع الرموز المختارة باستخدام الإطار الزمني نفسه وطول فترة الحساب نفسها. وهذا ضروري لإجراء مقارنة ذات معنى، لأن تغيير أي من هذين المتغيرين يغيّر أفق العائد وسجل التراجعات محل القياس
- حساب عائد فترة الحساب — يُحسب إجمالي عائد الشراء والاحتفاظ لكل رمز خلال فترة الحساب المحددة
- حساب مؤشر شدة التراجع — لكل رمز: تحديد القمة التاريخية المتغيرة ضمن تسلسل الحساب، قياس نسبة تراجع كل سعر إغلاق عن تلك القمة، تربيع قيم التراجع، حساب متوسط مربعات التراجعات، ثم أخذ الجذر التربيعي. والنتيجة هي قيمة مؤشر شدة التراجع للرمز خلال الفترة المحددة
- حساب نسبة مارتن وترتيبها — يُقسم عائد فترة الحساب على مؤشر شدة التراجع الخاص بالرمز. تشير القيم الأعلى إلى مزيج أكثر ملاءمة بين العائد والتراجع خلال فترة القياس المحددة
█ ملاحظات الاستخدام
ينبغي أن تكون فترة الحساب طويلة بما يكفي لتغطية فترة ذات دلالة من ظروف السوق، مثل فترة تراجع وتعافٍ لاحق. فترات الحساب القصيرة جدًا قد تُنتج نسبًا غير مستقرة أو مضللة، خاصة عندما لا يكون الأصل قد شهد تراجعًا ذا دلالة
كنقطة بداية عامة
• الحد الأدنى: نحو 180 يومًا تقويميًا (حوالي 6 أشهر)
• المُفضَّل: 365 يومًا تقويميًا (سنة واحدة) أو أكثر
هذه إرشادات عملية وليست حدودًا دنيا مُشتقة إحصائيًا. تعتمد فترة الحساب المناسبة على فئة الأصل والأفق الاستثماري المقصود. قد تتجاوز فترات الحساب الممتدة لعدة سنوات أو أكثر البيانات التاريخية المتاحة لبعض الرموز — خاصة الأصول المُدرجة حديثًا — مما يؤدي إلى ظهور قيم غير متاح
يحسب هذا التطبيق مقاييس كل رمز عبر فترة حساب متطابقة من الأيام التقويمية — وليس عددًا ثابتًا من الشموع — بحيث تغطي فترة حساب معينة (مثل 300 يوم) نفس الـ300 يوم التقويمي سواء للسهم أو للعملة الرقمية أو للعملات الفوركس، بصرف النظر عن عدد الشموع التي يُنتجها كل منها خلال تلك الفترة على أي إطار زمني معين. وهذا يجعل إعدادات فترة الحساب قابلة للمقارنة مباشرة عبر فئات الأصول المختلفة، بمعزل عن الإطار الزمني للرسم البياني
يبقى اعتماد واحد قائمًا: الرسم البياني المعروض الذي تُشاهد الجدول من خلاله هو ما يحدد توقيت تحديث الحساب الداخلي للتطبيق. فإذا كان الرسم البياني لسهم ذي جلسات تداول محدودة (أو ما شابه)، فقد لا تتمكن الرموز من أسواق مستمرة التداول مثل العملات الرقمية من تجميع سجل تقويمي كافٍ، وقد تظهر بقيمة "غير متاح" حتى ضمن فترة حساب مدعومة. عند الجمع بين فئات أصول مختلفة في الجدول نفسه، يُنصح بمشاهدة الجدول من رسم بياني لعملة رقمية أو فوركس لتجنب هذه المشكلة
█ الحد المرجعي لنسبة مارتن
حد اللون الأخضر لنسبة مارتن المستخدم في التطبيق هو وسيلة بصرية للمساعدة في الترتيب، وليس حداً فاصلاً مثبتاً إحصائياً. تُفسَّر ألوان الجدول على النحو التالي
• أعلى من الحد: أخضر
• بين الصفر والحد: رمادي
• أقل من الصفر: أحمر
ينبغي التعامل مع الحد باعتباره مستوى مرجعياً قابلاً للتعديل، وليس تعريفاً عاماً لما يُعد نسبة مارتن جيدة. تكون قيم نسبة مارتن أكثر دلالة عند مقارنة أوراق مالية حُسبت باستخدام المنهجية والإطار الزمني وفترة الحساب نفسها. ونظراً إلى أن التطبيق المستخدم هنا يعتمد على عوائد فترة الحساب غير محسوبة على أساس سنوي، فلا ينبغي اعتبار القيم معايير مطلقة عامة عبر إعدادات مختلفة للأطر الزمنية وفترات الحساب. للاستخدام العملي، يمكن معايرة الحد بما يتناسب مع خصائص الأصول المالية المرصودة أو مجموعة الأصول الاستثمارية الخاصة بالمستخدم
█ تفسير نسبة مارتن
يتضمن الجدول المقاييس التالية لكل رمز
- العائد الإجمالي — العائد المئوي التراكمي خلال فترة الحساب المحددة
- العائد السنوي — عائد النمو السنوي المركب لنفس الفترة، يُعرض للاطلاع فقط، ولا يؤثر على نسبة مارتن أو على الترتيب
- أقصى تراجع (أيام) — عدد الأيام التقويمية من القمة إلى القاع لأكبر (أعمق) تراجع لوحظ خلال الفترة
- % أقصى تراجع — حجم التراجع الأكبر، معبَّرًا عنه كنسبة انخفاض مئوية من قمته السابقة
- % فترة التراجع — النسبة المئوية للأيام التقويمية عبر فترة الحساب بأكملها التي كان فيها الأصل يتداول دون قمة سابقة، في أي تراجع وليس مقتصرًا على التراجع الأكبر فقط
- مؤشر شدة التراجع — مقياس يجمع بين عمق التراجع ومدته، ويُحسب كجذر تربيعي لمتوسط مربعات نسب التراجع عبر كل يوم في الفترة. وخلافًا لـ % أقصى تراجع، الذي يعكس فقط التراجع الأكبر، يعبّر مؤشر شدة التراجع عن التراكم الكلي "لمعاناة" الأصل من كل التراجعات التي مر بها فكلما كانت التراجعات أكبر وأطول أمدًا، ارتفعت قيمة المؤشر
- نسبة مارتن — العائد الإجمالي مقسومًا على مؤشر شدة التراجع، وتقيس العائد المُحقق مقابل كل وحدة من "معاناة" التراجع
ضمن مقارنة بإعدادات متطابقة
• نسبة مارتن الأعلى ← عائد أكبر مقارنةً بعبء التراجع التاريخي
• نسبة مارتن الموجبة المنخفضة ← عائد موجب، لكن مع ملف تراجع أقل ملاءمة
• نسبة مارتن السالبة ← عائد سالب خلال فترة الحساب المحددة
لذا، يُعد هذا التطبيق أداة مثالية للترتيب المقطعي لتحديد الأصول التي حققت أقوى عائد مقارنةً بعمق وديمومة تراجعاتها خلال نفس فترة الحساب
█ إخلاء المسؤولية
يُنشر هذا السكربت لأغراض تعليمية ومعلوماتية فقط، ولا يُعد نصيحة مالية أو استثمارية. تعتمد نسبة مارتن بالكامل على بيانات الأسعار التاريخية، ولا يُعد عمق التراجع أو مدته أو سرعة التعافي في الماضي مؤشراً على النتائج المستقبلية. احرص دائماً على إجراء أبحاثك الخاصة وتطبيق إدارة سليمة للمخاطر قبل اتخاذ أي قرارات استثمارية
Notas de Lançamento
Updated chart snapshot to keep the symbol, timeframe, and script name visible in the chart status lines, per TradingView requirements.
Aviso legal
As informações e publicações não se destinam a ser, e não constituem, conselhos ou recomendações financeiras, de investimento, comerciais ou de outro tipo fornecidos ou endossados pela TradingView. Leia mais nos Termos de Uso.
Aviso legal
As informações e publicações não se destinam a ser, e não constituem, conselhos ou recomendações financeiras, de investimento, comerciais ou de outro tipo fornecidos ou endossados pela TradingView. Leia mais nos Termos de Uso.