Edo Candle Context
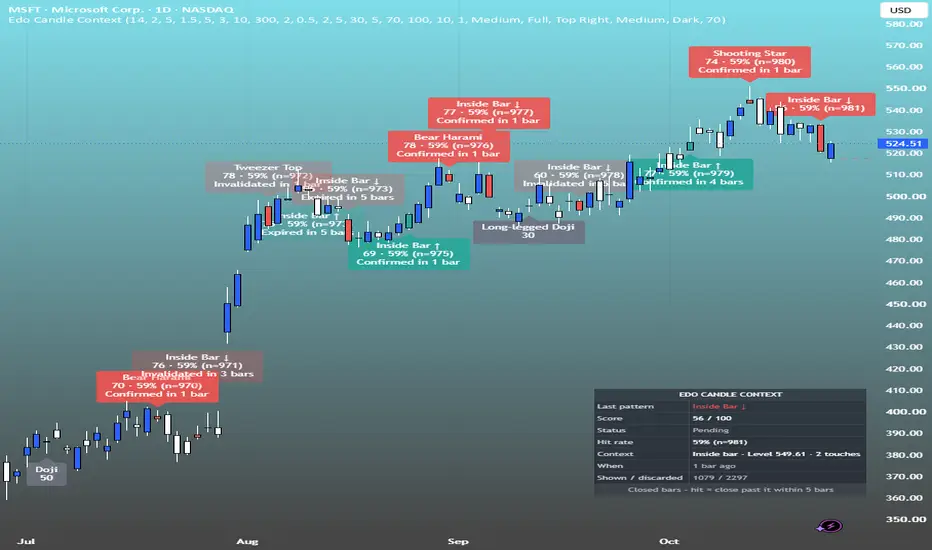
Edo Candle Context — Classic Candlestick Patterns Only Where They Matter, with a 0-100 Score, Tracking Until They Confirm or Fail, and a Hit Rate with Its n Visible


Candlestick patterns are the oldest tool in technical analysis and the noisiest when applied without judgement. A conventional detector marks every engulfing, every doji and every hammer on the chart, and the result is a screen full of labels where none stands out and none says anything about what happened next on that instrument. Edo Candle Context starts from the opposite idea: a pattern is not worth its shape but the place where it appears and what it does afterwards. It recognises the classic patterns in eleven groups, from single candles to three-candle formations, and draws one only when it reacts to a level built from confirmed pivots, to the most recent swing on the chart or to an excessive extension of price away from its 20-period average, and when its score reaches a minimum. Reversal patterns must also come from the opposite leg. One label per candle, a configurable silence between signals, everything evaluated on closed candles: the indicator does not repaint.
Every accepted pattern receives a score from 0 to 100 (size in ATR, strength of the close, proximity to the level and relative volume) and is drawn as a three-line label next to the candle: the name, the score with the symbol's hit rate and its n, for example 88 · 62% (n=226), and, once resolved, its status. Each pattern is an event with a life of its own: it stays Pending for a few candles and ends up Confirmed (a close beyond the pattern in its direction), Invalidated (a close beyond its other extreme) or Expired. From those outcomes the indicator calculates what percentage of patterns has been confirmed on the symbol and timeframe you are viewing, always with the number of events alongside. A Full or Compact panel summarises the last pattern, its score, its status, the exact context that validated it and that rate. The indicator is fully self-contained: levels, context, patterns and statistics are derived solely from the chart's price and volume series, with no dependency on any other tool.
THE CATALOGUE
Single-candle patterns: Hammer and Hanging Man (the same shape, named according to the leg it comes from), Inverted Hammer and Shooting Star, Doji with its Dragonfly, Gravestone and Long-legged variants, and Bull and Bear Marubozu as strength candles treated as continuation. Two-candle patterns: Bull and Bear Engulfing, Bull and Bear Harami and Harami Cross, Piercing Line and Dark Cloud Cover, Tweezer Bottom and Top. Three-candle patterns: Morning and Evening Star with their Doji Star versions, Three White Soldiers and Three Black Crows, Three Inside Up and Down. In addition, the Inside Bar confirmed by a breakout, which is handled in two steps. Every definition is expressed as proportions of body, wick and range against a 14-candle average body and the 14-period ATR, so the same thresholds work on an index at 5,000 points and on a currency pair at 1.10. Each of the eleven groups has its own switch.
THE CONTEXT FILTER
No pattern is drawn without context. The indicator builds its own map of levels from the chart's confirmed pivots: a pivot high is a candle whose high exceeds that of the ten candles on each side, a pivot low is the mirror image, and pivots that fall within half an ATR of each other are merged into a single level whose price is the weighted average of its touches. A level counts as context when it has at least two touches and the extreme of the pattern (the low on bullish patterns, the high on bearish ones) sits within half an ATR of it, or the pattern pierces it. If no level qualifies, the last swing low or high counts, whatever its number of touches: it is the most immediate structural reference. As a third option, which can be switched off, a pattern is accepted when the close is stretched at least two ATR below or above the 20-period exponential moving average in the direction the pattern turns. Levels expire after three hundred candles without a pivot renewing them, so the context is always up to date.
THE DIRECTION GATE AND ONE LABEL PER CANDLE
A reversal only makes sense if there is something to reverse, so bullish reversals must come from a bearish leg and bearish ones from a bullish leg, measured before the pattern begins: the prior close against the close five candles earlier. Continuation patterns, the doji and the inside bar do not pass through this gate, because they signal strength, indecision or compression rather than a reversal. When several definitions coincide on the same candle (the third candle of a Morning Star is often a Bull Engulfing as well; a Harami Cross is both a Harami and a Doji), the indicator picks just one: the pattern with more candles wins and, on a tie, the more specific one. The label therefore always describes the most complete structure on that candle.
THE 0-100 SCORE
The score adds up four components: the size of the formation in ATR (25 points), the strength of the close in the direction of the pattern (20), the proximity of the pattern's extreme to the level or extension that provided the context (30) and the relative volume against its 20-candle average (25, with a neutral value on symbols without volume). Min Pattern Score (30 by default) discards patterns below that score in the same way as those that fail the context check. The full breakdown appears in the tooltip of each label. The score describes how well formed and well placed the pattern is; it is not a prediction.
THE LIFE OF A PATTERN AND THE HIT RATE
After the label is drawn, the pattern is Pending for up to Hit Window candles (5 by default). It becomes Confirmed when a candle closes above the high of the signal candle on a bullish pattern, or below its low on a bearish one; it becomes Invalidated if a candle first closes beyond the other extreme of the whole pattern; and Expired if neither happens in time. Only the text and the tint of that candle's label change, once, on the close that decides it. The hit rate is Confirmed divided by all the events already decided on the symbol and timeframe you are viewing, with the n alongside and also by family in the tooltip; pending patterns and dojis (which have no direction) do not count. It uses only closed candles, so it does not repaint, but it depends on the loaded history: it is that chart's statistic, not a promise.
THE INSIDE BAR
The inside bar is a compression candle whose range sits within that of the previous one, and on its own it says nothing about which way it will resolve. The indicator arms it when the mother candle is in context and draws nothing yet; if within the next five candles a close breaks the mother's high, Inside Bar ↑ is marked on that breakout candle, and Inside Bar ↓ if it breaks the low. If the window passes without a breakout, the inside bar expires without leaving a trace. The label goes on the breakout because it is the breakout that provides the direction, and from there it follows the same life as any other pattern.
SIGNAL SILENCE, LABELS AND SCANNER MODE
After each pattern is drawn, the chart stays silent for a configurable number of candles, three by default, whatever the direction of the next candidate; with zero, everything that passes the filters is shown. Labels closer than six candles on the same side are stacked vertically up to three levels, a configurable cap (Max Labels, 100) keeps the chart readable and, with more than 250 candles visible, each label shrinks to its score with the full text in the tooltip. Bullish patterns and dojis sit below the candle, bearish ones above, in the colour of their direction, and an invalidated or expired pattern is faded. The Require Context switch is on by default and is the core of the indicator; switched off, Edo Candle Context becomes a classic scanner that labels everything matching the definition (the tooltip reads No context (filter off)). Show Unfiltered Patterns marks what the filter left out with a faded dot, so you can see what was discarded.
RIGHT-EDGE LABELS AND LEVEL LINK
To the right of the last candle the indicator draws the last swing high and the last swing low, the levels patterns react to, with their price and their distance in percent from the close, for example Swing high 38.92 +30.2 %. Projection (bars) sets the length of the line, the label ends where the line ends and grows to the left without running past the edge, and Label Spacing (ATR) keeps them apart, also when the chart is zoomed out, with a dotted connector when one is pushed away from its level. Draw Level Link, off by default, adds a dashed line from the level that validated each pattern to the candle that reacted, and Highlight Pattern Candle paints the pattern candle in the colour of its direction.
INFORMATION PANEL
The panel has two levels of detail. Compact shows Last pattern, Score, Status and Hit rate. Full adds Context (the reference that validated the pattern: a level with its price and touches, a swing with its price, or an extension in ATR), When (how many candles ago) and Shown / discarded (patterns drawn against patterns discarded across the loaded history), with a footer that recalls the definition of confirmation. With Keep Panel Off the Drawing the panel stays in the chosen corner as long as there is free space and, if not, moves to another corner of the visible part of the chart so it does not cover candles or right-edge labels, while also leaving room for the TradingView logo, button and legend. Panel Position, Panel Size, Panel Opacity and Show Panel complete the controls.
DARK AND LIGHT THEME
Theme Mode adapts the colours of the panel and the labels to the chart background. In the light theme the labels are drawn opaque and the lines more solid so that everything stays readable on a white background. It should match the TradingView background: Dark on a white background looks washed out.
ALERTS
Fifteen predefined alerts. By family: Any bullish pattern, Any bearish pattern, Doji at level, Engulfing in context, Harami in context, Piercing / Dark Cloud, Tweezer in context, Morning / Evening Star, Pin bar in context, Three-candle pattern, Inside bar breakout and Marubozu in context. And on the score and life of the pattern: High score pattern (score equal to or above High Score Alert Level, 70 by default), Pattern confirmed and Pattern invalidated, which fire on the candle that decides the outcome of an earlier pattern. All fire at the candle close; the pattern alerts fire only for patterns that have passed the filters (or, with the filter off, for every pattern detected) and respect the silence, so two patterns within the window generate a single alert.
HOW TO READ IT
Start with the panel: which pattern it is, with what score and what validated it. A Hammer on a level with four touches after a decline is a clear market response at a known place; the same Hammer validated by a two-ATR extension is exhaustion without a level, useful but less precise for placing a stop. Read the score as the quality of the formation and the hit rate as the history of the symbol, always looking at the n: a rate with n=12 says much less than one with n=600. Read size as quality: three-candle patterns describe a complete reversal process, while dojis are warnings that need the next candle. Tell continuation from reversal: a Marubozu or Three White Soldiers on a level is the breakout or the defence of that level with strength, not a reversal. And read it in confluence: a daily pattern that coincides with a weekly level carries far more weight than either alone, and since the indicator uses no higher timeframe, the way to exploit that is a second chart of the same instrument.
WHAT CHANGES AS A CANDLE FORMS
Patterns are read only at the candle close: a label never appears on the forming candle and, once drawn, it does not move or disappear; its score, its context and the printed rate are frozen at that close, and only its status changes, once, when it is decided. The right-edge labels and the panel corner follow the visible part of the chart, so they can change when you scroll or zoom; the patterns, the statistics and the alerts do not.
KNOWN LIMITATIONS
The decision to shrink labels to their score when zoomed far out is taken when the history is calculated, and TradingView only recalculates it when the symbol or timeframe changes, or on reload, not on zoom or when a setting changes: it is best to set the zoom before switching symbol. A label is between 8 and 10 candles wide with about a hundred on screen, more than the stacking margin and the default silence, so in very active areas labels can overlap or be covered by candles; raising Signal Silence spaces them out. The automatic panel corner takes candles and right-edge labels into account but not pattern labels, and a pattern label on the last few candles can overlap the Swing high or Swing low label. With few candles loaded or on long timeframes the n of the hit rate is small and the figure is inconclusive.
NO REPAINTING
Every pattern is evaluated on a closed candle, pivots are used only once they are confirmed, the inside bar is marked only on the candle that breaks the mother candle, the outcome of each pattern is written once and never revised, and there are no higher-timeframe functions. A label, once drawn, never moves or disappears.
CONFIGURATION
The inputs are grouped by block, all with tooltips. Patterns: the eleven group switches and the shape thresholds: average body length (14), pin bar wick-to-body ratio (2.0), doji body as a percentage of the range (5), marubozu body against the average (1.5) and inside bar breakout window (5). Context: Require Context (on), Signal Silence (3, from 0 to 50), pivot length (10), level lifetime (300 candles), minimum touches (2), maximum distance to the level in ATR (0.5), extension as context (on, 2.0 ATR from the 20-period average), trend lookback (5) and the option to show discarded patterns as dots. Score and Statistics: minimum score (30), Hit Window (5 candles) and alert score level (70). Display: label cap (100), right-edge labels, projection (10), spacing (ATR), label size (Small / Medium / Large), level link and highlighted candle. Style: bullish, bearish and neutral colours. Panel: visibility, Full / Compact detail, preferred corner, automatic corner, size, Dark / Light theme and opacity. The defaults are calibrated to work without adjustment on stocks, crypto, forex, indices and futures on any timeframe; the inputs most users touch are the signal silence, to get more or fewer labels, the pivot length, to match the level map to their own horizon, and the minimum score.
OPEN SOURCE
Edo Candle Context is published as a free open source indicator. The full Pine Script is publicly accessible on TradingView for study, adaptation and integration into any workflow. Part of the Edolab Markets free tools ecosystem, all available on TradingView.
This indicator is a technical analysis tool for educational and informational purposes only. It does not generate automatic buy or sell signals and should not be considered financial advice. Trading financial markets involves significant risk of capital loss. Past performance does not guarantee future results. Always use proper risk management.
Candlestick patterns are the oldest tool in technical analysis and the noisiest when applied without judgement. A conventional detector marks every engulfing, every doji and every hammer on the chart, and the result is a screen full of labels where none stands out and none says anything about what happened next on that instrument. Edo Candle Context starts from the opposite idea: a pattern is not worth its shape but the place where it appears and what it does afterwards. It recognises the classic patterns in eleven groups, from single candles to three-candle formations, and draws one only when it reacts to a level built from confirmed pivots, to the most recent swing on the chart or to an excessive extension of price away from its 20-period average, and when its score reaches a minimum. Reversal patterns must also come from the opposite leg. One label per candle, a configurable silence between signals, everything evaluated on closed candles: the indicator does not repaint.
Every accepted pattern receives a score from 0 to 100 (size in ATR, strength of the close, proximity to the level and relative volume) and is drawn as a three-line label next to the candle: the name, the score with the symbol's hit rate and its n, for example 88 · 62% (n=226), and, once resolved, its status. Each pattern is an event with a life of its own: it stays Pending for a few candles and ends up Confirmed (a close beyond the pattern in its direction), Invalidated (a close beyond its other extreme) or Expired. From those outcomes the indicator calculates what percentage of patterns has been confirmed on the symbol and timeframe you are viewing, always with the number of events alongside. A Full or Compact panel summarises the last pattern, its score, its status, the exact context that validated it and that rate. The indicator is fully self-contained: levels, context, patterns and statistics are derived solely from the chart's price and volume series, with no dependency on any other tool.
THE CATALOGUE
Single-candle patterns: Hammer and Hanging Man (the same shape, named according to the leg it comes from), Inverted Hammer and Shooting Star, Doji with its Dragonfly, Gravestone and Long-legged variants, and Bull and Bear Marubozu as strength candles treated as continuation. Two-candle patterns: Bull and Bear Engulfing, Bull and Bear Harami and Harami Cross, Piercing Line and Dark Cloud Cover, Tweezer Bottom and Top. Three-candle patterns: Morning and Evening Star with their Doji Star versions, Three White Soldiers and Three Black Crows, Three Inside Up and Down. In addition, the Inside Bar confirmed by a breakout, which is handled in two steps. Every definition is expressed as proportions of body, wick and range against a 14-candle average body and the 14-period ATR, so the same thresholds work on an index at 5,000 points and on a currency pair at 1.10. Each of the eleven groups has its own switch.
THE CONTEXT FILTER
No pattern is drawn without context. The indicator builds its own map of levels from the chart's confirmed pivots: a pivot high is a candle whose high exceeds that of the ten candles on each side, a pivot low is the mirror image, and pivots that fall within half an ATR of each other are merged into a single level whose price is the weighted average of its touches. A level counts as context when it has at least two touches and the extreme of the pattern (the low on bullish patterns, the high on bearish ones) sits within half an ATR of it, or the pattern pierces it. If no level qualifies, the last swing low or high counts, whatever its number of touches: it is the most immediate structural reference. As a third option, which can be switched off, a pattern is accepted when the close is stretched at least two ATR below or above the 20-period exponential moving average in the direction the pattern turns. Levels expire after three hundred candles without a pivot renewing them, so the context is always up to date.
THE DIRECTION GATE AND ONE LABEL PER CANDLE
A reversal only makes sense if there is something to reverse, so bullish reversals must come from a bearish leg and bearish ones from a bullish leg, measured before the pattern begins: the prior close against the close five candles earlier. Continuation patterns, the doji and the inside bar do not pass through this gate, because they signal strength, indecision or compression rather than a reversal. When several definitions coincide on the same candle (the third candle of a Morning Star is often a Bull Engulfing as well; a Harami Cross is both a Harami and a Doji), the indicator picks just one: the pattern with more candles wins and, on a tie, the more specific one. The label therefore always describes the most complete structure on that candle.
THE 0-100 SCORE
The score adds up four components: the size of the formation in ATR (25 points), the strength of the close in the direction of the pattern (20), the proximity of the pattern's extreme to the level or extension that provided the context (30) and the relative volume against its 20-candle average (25, with a neutral value on symbols without volume). Min Pattern Score (30 by default) discards patterns below that score in the same way as those that fail the context check. The full breakdown appears in the tooltip of each label. The score describes how well formed and well placed the pattern is; it is not a prediction.
THE LIFE OF A PATTERN AND THE HIT RATE
After the label is drawn, the pattern is Pending for up to Hit Window candles (5 by default). It becomes Confirmed when a candle closes above the high of the signal candle on a bullish pattern, or below its low on a bearish one; it becomes Invalidated if a candle first closes beyond the other extreme of the whole pattern; and Expired if neither happens in time. Only the text and the tint of that candle's label change, once, on the close that decides it. The hit rate is Confirmed divided by all the events already decided on the symbol and timeframe you are viewing, with the n alongside and also by family in the tooltip; pending patterns and dojis (which have no direction) do not count. It uses only closed candles, so it does not repaint, but it depends on the loaded history: it is that chart's statistic, not a promise.
THE INSIDE BAR
The inside bar is a compression candle whose range sits within that of the previous one, and on its own it says nothing about which way it will resolve. The indicator arms it when the mother candle is in context and draws nothing yet; if within the next five candles a close breaks the mother's high, Inside Bar ↑ is marked on that breakout candle, and Inside Bar ↓ if it breaks the low. If the window passes without a breakout, the inside bar expires without leaving a trace. The label goes on the breakout because it is the breakout that provides the direction, and from there it follows the same life as any other pattern.
SIGNAL SILENCE, LABELS AND SCANNER MODE
After each pattern is drawn, the chart stays silent for a configurable number of candles, three by default, whatever the direction of the next candidate; with zero, everything that passes the filters is shown. Labels closer than six candles on the same side are stacked vertically up to three levels, a configurable cap (Max Labels, 100) keeps the chart readable and, with more than 250 candles visible, each label shrinks to its score with the full text in the tooltip. Bullish patterns and dojis sit below the candle, bearish ones above, in the colour of their direction, and an invalidated or expired pattern is faded. The Require Context switch is on by default and is the core of the indicator; switched off, Edo Candle Context becomes a classic scanner that labels everything matching the definition (the tooltip reads No context (filter off)). Show Unfiltered Patterns marks what the filter left out with a faded dot, so you can see what was discarded.
RIGHT-EDGE LABELS AND LEVEL LINK
To the right of the last candle the indicator draws the last swing high and the last swing low, the levels patterns react to, with their price and their distance in percent from the close, for example Swing high 38.92 +30.2 %. Projection (bars) sets the length of the line, the label ends where the line ends and grows to the left without running past the edge, and Label Spacing (ATR) keeps them apart, also when the chart is zoomed out, with a dotted connector when one is pushed away from its level. Draw Level Link, off by default, adds a dashed line from the level that validated each pattern to the candle that reacted, and Highlight Pattern Candle paints the pattern candle in the colour of its direction.
INFORMATION PANEL
The panel has two levels of detail. Compact shows Last pattern, Score, Status and Hit rate. Full adds Context (the reference that validated the pattern: a level with its price and touches, a swing with its price, or an extension in ATR), When (how many candles ago) and Shown / discarded (patterns drawn against patterns discarded across the loaded history), with a footer that recalls the definition of confirmation. With Keep Panel Off the Drawing the panel stays in the chosen corner as long as there is free space and, if not, moves to another corner of the visible part of the chart so it does not cover candles or right-edge labels, while also leaving room for the TradingView logo, button and legend. Panel Position, Panel Size, Panel Opacity and Show Panel complete the controls.
DARK AND LIGHT THEME
Theme Mode adapts the colours of the panel and the labels to the chart background. In the light theme the labels are drawn opaque and the lines more solid so that everything stays readable on a white background. It should match the TradingView background: Dark on a white background looks washed out.
ALERTS
Fifteen predefined alerts. By family: Any bullish pattern, Any bearish pattern, Doji at level, Engulfing in context, Harami in context, Piercing / Dark Cloud, Tweezer in context, Morning / Evening Star, Pin bar in context, Three-candle pattern, Inside bar breakout and Marubozu in context. And on the score and life of the pattern: High score pattern (score equal to or above High Score Alert Level, 70 by default), Pattern confirmed and Pattern invalidated, which fire on the candle that decides the outcome of an earlier pattern. All fire at the candle close; the pattern alerts fire only for patterns that have passed the filters (or, with the filter off, for every pattern detected) and respect the silence, so two patterns within the window generate a single alert.
HOW TO READ IT
Start with the panel: which pattern it is, with what score and what validated it. A Hammer on a level with four touches after a decline is a clear market response at a known place; the same Hammer validated by a two-ATR extension is exhaustion without a level, useful but less precise for placing a stop. Read the score as the quality of the formation and the hit rate as the history of the symbol, always looking at the n: a rate with n=12 says much less than one with n=600. Read size as quality: three-candle patterns describe a complete reversal process, while dojis are warnings that need the next candle. Tell continuation from reversal: a Marubozu or Three White Soldiers on a level is the breakout or the defence of that level with strength, not a reversal. And read it in confluence: a daily pattern that coincides with a weekly level carries far more weight than either alone, and since the indicator uses no higher timeframe, the way to exploit that is a second chart of the same instrument.
WHAT CHANGES AS A CANDLE FORMS
Patterns are read only at the candle close: a label never appears on the forming candle and, once drawn, it does not move or disappear; its score, its context and the printed rate are frozen at that close, and only its status changes, once, when it is decided. The right-edge labels and the panel corner follow the visible part of the chart, so they can change when you scroll or zoom; the patterns, the statistics and the alerts do not.
KNOWN LIMITATIONS
The decision to shrink labels to their score when zoomed far out is taken when the history is calculated, and TradingView only recalculates it when the symbol or timeframe changes, or on reload, not on zoom or when a setting changes: it is best to set the zoom before switching symbol. A label is between 8 and 10 candles wide with about a hundred on screen, more than the stacking margin and the default silence, so in very active areas labels can overlap or be covered by candles; raising Signal Silence spaces them out. The automatic panel corner takes candles and right-edge labels into account but not pattern labels, and a pattern label on the last few candles can overlap the Swing high or Swing low label. With few candles loaded or on long timeframes the n of the hit rate is small and the figure is inconclusive.
NO REPAINTING
Every pattern is evaluated on a closed candle, pivots are used only once they are confirmed, the inside bar is marked only on the candle that breaks the mother candle, the outcome of each pattern is written once and never revised, and there are no higher-timeframe functions. A label, once drawn, never moves or disappears.
CONFIGURATION
The inputs are grouped by block, all with tooltips. Patterns: the eleven group switches and the shape thresholds: average body length (14), pin bar wick-to-body ratio (2.0), doji body as a percentage of the range (5), marubozu body against the average (1.5) and inside bar breakout window (5). Context: Require Context (on), Signal Silence (3, from 0 to 50), pivot length (10), level lifetime (300 candles), minimum touches (2), maximum distance to the level in ATR (0.5), extension as context (on, 2.0 ATR from the 20-period average), trend lookback (5) and the option to show discarded patterns as dots. Score and Statistics: minimum score (30), Hit Window (5 candles) and alert score level (70). Display: label cap (100), right-edge labels, projection (10), spacing (ATR), label size (Small / Medium / Large), level link and highlighted candle. Style: bullish, bearish and neutral colours. Panel: visibility, Full / Compact detail, preferred corner, automatic corner, size, Dark / Light theme and opacity. The defaults are calibrated to work without adjustment on stocks, crypto, forex, indices and futures on any timeframe; the inputs most users touch are the signal silence, to get more or fewer labels, the pivot length, to match the level map to their own horizon, and the minimum score.
OPEN SOURCE
Edo Candle Context is published as a free open source indicator. The full Pine Script is publicly accessible on TradingView for study, adaptation and integration into any workflow. Part of the Edolab Markets free tools ecosystem, all available on TradingView.
This indicator is a technical analysis tool for educational and informational purposes only. It does not generate automatic buy or sell signals and should not be considered financial advice. Trading financial markets involves significant risk of capital loss. Past performance does not guarantee future results. Always use proper risk management.

EdoLab Markets – Precision Trading Tools
Get Exclusive Indicators:
edolab.io
All content provided is for informational and educational purposes only. Past performance does not guarantee future results.
Get Exclusive Indicators:
edolab.io
All content provided is for informational and educational purposes only. Past performance does not guarantee future results.
Aviso legal
As informações e publicações não se destinam a ser, e não constituem, conselhos ou recomendações financeiras, de investimento, comerciais ou de outro tipo fornecidos ou endossados pela TradingView. Leia mais nos Termos de Uso.
EdoLab Markets – Precision Trading Tools
Get Exclusive Indicators:
edolab.io
All content provided is for informational and educational purposes only. Past performance does not guarantee future results.
Get Exclusive Indicators:
edolab.io
All content provided is for informational and educational purposes only. Past performance does not guarantee future results.
Aviso legal
As informações e publicações não se destinam a ser, e não constituem, conselhos ou recomendações financeiras, de investimento, comerciais ou de outro tipo fornecidos ou endossados pela TradingView. Leia mais nos Termos de Uso.