Trend Angle Momentum [MarkitTick]
More exclusive indicators from MarkitTick
Subscribe to MarkitTick for $43.75/month to get exclusive indicators by this author. You pay right on TradingView and can use them on your charts straight away.
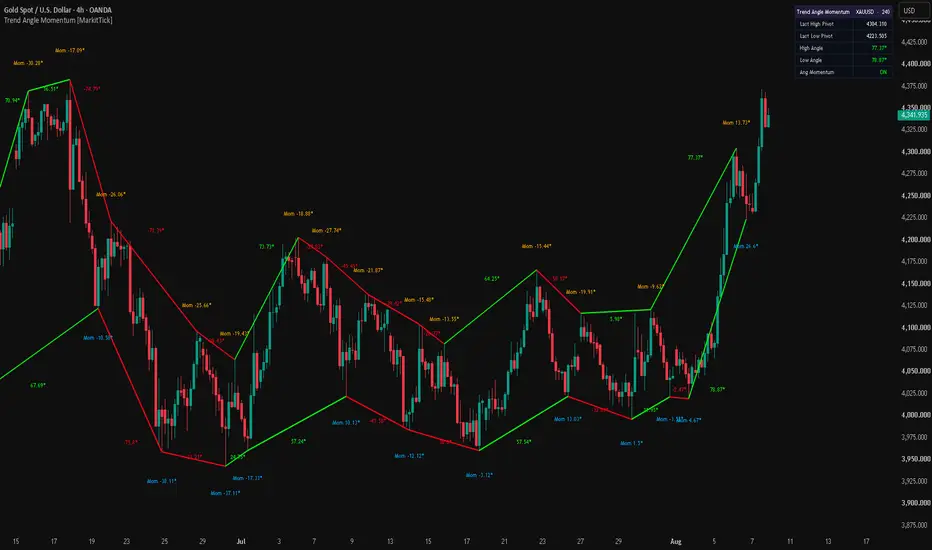
Explore MarkitTick💡 This tool measures market structure not just as a sequence of highs and lows, but as a rate of directional change. It detects confirmed swing pivots and then calculates the geometric angle of the trendline connecting each pivot to the one before it, translating pure price action into a single, intuitive metric: degrees of trend steepness. Instead of asking traders to infer momentum from candle shape or oscillator divergence, it hands them a number — the actual angle of ascent or descent between structural turning points — along with an optional smoothed reading of how that angle is evolving over time.
✨ Originality and Utility
Most swing-detection tools stop at marking the high or low. This script goes a step further by quantifying the relationship between consecutive swings using trigonometry. Each swing-to-swing move is converted into a percentage price change, which is then run through an arctangent function to produce a true geometric angle in degrees, independent of the instrument's absolute price scale. A move on a $2 stock and a move on a $2,000 stock that share the same percentage steepness will report the same angle, making the readings comparable across symbols and timeframes in a way that raw price-based slope calculations cannot achieve.
The utility here is twofold. First, the angle itself acts as a quantified momentum proxy: a shallow angle after a strong prior swing signals decelerating momentum well before a lagging oscillator would confirm it, while a steepening angle on successive swings signals acceleration. Second, an optional Angle Momentum layer tracks a rolling average of the last several swing angles, smoothing out single-swing noise and revealing whether the broader structural rhythm of the market is strengthening or weakening. This combination — geometric normalization plus rolling angle smoothing — gives traders a structural momentum read that is not available from stock pivot tools or generic slope indicators alone.
🔬 Methodology and Concepts

• Confirmed Pivot Detection
The script identifies swing highs and swing lows using a symmetric fractal method: a bar is only confirmed as a pivot high if it is higher than a defined number of bars to its left and right, and likewise for a pivot low. The "Left Bars" and "Right Bars" inputs control how many bars on each side must confirm the extreme. Because the right-side bars must fully close before a pivot can be validated, every pivot marked on the chart is confirmed historical structure, not a live, moving estimate — the marker is deliberately plotted with a backward offset equal to the right-bar count so that its horizontal position matches where the actual swing extreme occurred, not where it was confirmed.
• Percent-to-Angle Conversion
Once two consecutive confirmed pivots of the same type (high-to-high or low-to-low) are available, the script calculates the percentage price change between them. This percentage is then optionally normalized by the number of bars separating the two pivots (via the "Normalize Angle by Bars" input), which converts the reading from "how much did price move" into "how much did price move per bar," a more useful measure of steepness when swings vary widely in duration. The resulting rate is passed through an arctangent function and converted from radians to degrees, producing a bounded, intuitive angle: values approaching plus or minus ninety degrees represent extremely steep percentage moves, while values near zero represent flat, sideways structure.
• Angle Momentum (Optional Smoothing Layer)
When enabled, the script maintains a running array of the most recent swing angles (separately for highs and lows) and reports their simple average over a user-defined lookback length. This produces a second-order reading: rather than looking at a single swing's angle in isolation, it shows whether the sequence of recent swing angles is, on average, steep or shallow, positive or negative — a way of gauging whether structural momentum is building or fading across several swings rather than just the most recent one.
• Live Dashboard
A compact on-chart table continuously summarizes the last confirmed high pivot price, the last confirmed low pivot price, the most recent high-swing angle, the most recent low-swing angle, and whether Angle Momentum smoothing is currently active, giving traders a persistent numerical snapshot without needing to hover over chart objects.
🎨 Visual Guide

📖 How to Use

⚠️ Confirmation Lag Notice
All pivots and their associated angle calculations are confirmed structure. Because a pivot cannot be validated until the required number of bars on its right side have closed, every marker, line, and label is necessarily plotted a number of bars after the actual high or low occurred, equal to the "Right Bars" setting. The plotted markers are intentionally offset backward to align visually with the true location of the swing extreme — this does not mean the indicator is predicting or anticipating pivots in real time. Traders should treat swing confirmations as lagging structural events by design, not as leading signals.
⚙️ Inputs and Settings
🔍 Deconstruction of the Underlying Scientific and Academic Framework
The core of this indicator rests on classical trigonometric slope analysis rather than any single named technical analysis school. Converting a price move into an angle is mathematically equivalent to computing the arctangent of a rate of change, the same operation used broadly in engineering and physics to express a gradient as an angular measure rather than a raw ratio. Expressing the swing-to-swing move as a percentage change before applying the arctangent function normalizes the calculation across instruments of different absolute price levels, addressing a well-known limitation of naive "price-per-bar" slope measures, which are not comparable between a low-priced and high-priced instrument, or between two different timeframes without adjustment. The optional bar-normalization step draws on the same logic used in rate-of-change and momentum oscillators broadly, where a raw price delta is scaled by the time or bar interval over which it occurred to produce a comparable velocity-style reading rather than a simple magnitude.
The pivot detection mechanism itself is a fractal/symmetric extremum test, a widely used method in swing-structure analysis (related in spirit to Bill Williams' fractal indicator and to classical Dow Theory's emphasis on confirmed swing highs and lows as the building blocks of trend structure) that requires a candidate bar to dominate a defined number of bars on both sides before being accepted as a genuine local extremum. This symmetric confirmation requirement is a standard technique for filtering transient noise out of swing-point identification, at the deliberate cost of confirmation lag, a well-documented trade-off in any lookback-based extremum detection method. The Angle Momentum layer applies a simple moving average — one of the most foundational smoothing techniques in time-series analysis — to the sequence of discrete angle readings themselves rather than to price, effectively treating "swing angle" as its own derived data series and smoothing it the same way a moving average would smooth a price or oscillator series, in order to separate signal (the underlying trend in momentum) from noise (single-swing outliers).
⚠️ Disclaimer
All provided scripts and indicators are strictly for educational exploration and must not be interpreted as financial advice or a recommendation to execute trades. We expressly disclaim all liability for any financial losses or damages that may result, directly or indirectly, from the reliance on or application of these tools. Market participation carries inherent risk where past performance never guarantees future returns, leaving all investment decisions and due diligence solely at your own discretion.
✨ Originality and Utility
Most swing-detection tools stop at marking the high or low. This script goes a step further by quantifying the relationship between consecutive swings using trigonometry. Each swing-to-swing move is converted into a percentage price change, which is then run through an arctangent function to produce a true geometric angle in degrees, independent of the instrument's absolute price scale. A move on a $2 stock and a move on a $2,000 stock that share the same percentage steepness will report the same angle, making the readings comparable across symbols and timeframes in a way that raw price-based slope calculations cannot achieve.
The utility here is twofold. First, the angle itself acts as a quantified momentum proxy: a shallow angle after a strong prior swing signals decelerating momentum well before a lagging oscillator would confirm it, while a steepening angle on successive swings signals acceleration. Second, an optional Angle Momentum layer tracks a rolling average of the last several swing angles, smoothing out single-swing noise and revealing whether the broader structural rhythm of the market is strengthening or weakening. This combination — geometric normalization plus rolling angle smoothing — gives traders a structural momentum read that is not available from stock pivot tools or generic slope indicators alone.
🔬 Methodology and Concepts
• Confirmed Pivot Detection
The script identifies swing highs and swing lows using a symmetric fractal method: a bar is only confirmed as a pivot high if it is higher than a defined number of bars to its left and right, and likewise for a pivot low. The "Left Bars" and "Right Bars" inputs control how many bars on each side must confirm the extreme. Because the right-side bars must fully close before a pivot can be validated, every pivot marked on the chart is confirmed historical structure, not a live, moving estimate — the marker is deliberately plotted with a backward offset equal to the right-bar count so that its horizontal position matches where the actual swing extreme occurred, not where it was confirmed.
• Percent-to-Angle Conversion
Once two consecutive confirmed pivots of the same type (high-to-high or low-to-low) are available, the script calculates the percentage price change between them. This percentage is then optionally normalized by the number of bars separating the two pivots (via the "Normalize Angle by Bars" input), which converts the reading from "how much did price move" into "how much did price move per bar," a more useful measure of steepness when swings vary widely in duration. The resulting rate is passed through an arctangent function and converted from radians to degrees, producing a bounded, intuitive angle: values approaching plus or minus ninety degrees represent extremely steep percentage moves, while values near zero represent flat, sideways structure.
• Angle Momentum (Optional Smoothing Layer)
When enabled, the script maintains a running array of the most recent swing angles (separately for highs and lows) and reports their simple average over a user-defined lookback length. This produces a second-order reading: rather than looking at a single swing's angle in isolation, it shows whether the sequence of recent swing angles is, on average, steep or shallow, positive or negative — a way of gauging whether structural momentum is building or fading across several swings rather than just the most recent one.
• Live Dashboard
A compact on-chart table continuously summarizes the last confirmed high pivot price, the last confirmed low pivot price, the most recent high-swing angle, the most recent low-swing angle, and whether Angle Momentum smoothing is currently active, giving traders a persistent numerical snapshot without needing to hover over chart objects.
🎨 Visual Guide
- Diagonal trend lines connecting consecutive swing highs (default red/green by angle sign) and consecutive swing lows are drawn directly between the two pivot points, visually representing the geometric slope being measured.
- A small numeric label at the midpoint of each swing line displays the calculated angle in degrees, colored green for a positive (upward) angle and red for a negative (downward) angle by default.
- When Angle Momentum is enabled, an additional label appears at the most recent pivot showing the smoothed "Mom" value in a distinct color (orange for highs, blue for lows by default), separated visually from the raw single-swing angle label.
- Cross-style markers plot at each confirmed pivot high and pivot low directly on price, offset backward to align with the actual bar where the extreme occurred.
- The dashboard table (position configurable) shows the symbol, timeframe, last high and low pivot prices, the latest angle readings for each, and the current on/off state of Angle Momentum.
📖 How to Use
- Treat the angle label on each swing line as a normalized momentum reading for that specific leg of price action: steep angles indicate strong directional conviction, shallow angles indicate a weakening or consolidating move.
- Compare the angle of the most recent swing to the angle of the swing before it. A sequence of progressively shallower high-to-high angles during an uptrend can indicate fading bullish momentum even while price is still making new highs, a structural early warning that pure price action alone may not show.
- When Angle Momentum is enabled, use the smoothed "Mom" reading as a broader confirmation layer: a rising average angle across several swings supports the idea that momentum is genuinely building, rather than reacting to a single outlier swing.
- Divergences between price structure and angle behavior — for example, higher swing highs paired with a declining angle momentum reading — can be used as a discretionary caution signal ahead of a potential trend deceleration.
- The two alert conditions ("High Pivot Formed" and "Low Pivot Formed") can be used to build automated or semi-automated workflows that trigger only once a swing point is fully confirmed, rather than on every bar.
⚠️ Confirmation Lag Notice
All pivots and their associated angle calculations are confirmed structure. Because a pivot cannot be validated until the required number of bars on its right side have closed, every marker, line, and label is necessarily plotted a number of bars after the actual high or low occurred, equal to the "Right Bars" setting. The plotted markers are intentionally offset backward to align visually with the true location of the swing extreme — this does not mean the indicator is predicting or anticipating pivots in real time. Traders should treat swing confirmations as lagging structural events by design, not as leading signals.
⚙️ Inputs and Settings
- Left Bars / Right Bars: Define the symmetric lookback and lookahead window used to validate a swing high or low. Larger values filter out minor fluctuations and confirm only more significant structural turning points, at the cost of a longer confirmation delay. Smaller values confirm pivots faster but are more sensitive to short-term noise.
- Show High Swing Lines / Show Low Swing Lines: Independently toggle the diagonal trend lines connecting consecutive high or low pivots.
- Show Swing Point Dots: Toggles the cross markers plotted directly at each confirmed pivot price.
- Normalize Angle by Bars: When enabled, divides the percentage move between two pivots by the number of bars separating them before calculating the angle, producing a "steepness per bar" measure rather than a raw total-move angle. Useful for comparing swings of different durations on a more equal footing.
- Use Angle Momentum: Enables the rolling average smoothing layer over the last several swing angles, plotted as an additional label at each new pivot.
- Angle Momentum Length: Sets how many recent swing angles are averaged together for the smoothed momentum reading. Shorter lengths react faster to recent swings; longer lengths produce a smoother, slower-changing average.
- Dashboard Position / Show Dashboard: Controls visibility and screen placement of the summary table.
- High Pivot Action / Low Pivot Action: Custom text tags embedded into the JSON alert payload for each pivot type, useful for routing alerts to external automation systems that key off a specific action string.
- Color inputs: Independently control the color of swing lines, angle text, pivot cross markers, momentum labels, and dashboard theming to match personal charting preferences.
🔍 Deconstruction of the Underlying Scientific and Academic Framework
The core of this indicator rests on classical trigonometric slope analysis rather than any single named technical analysis school. Converting a price move into an angle is mathematically equivalent to computing the arctangent of a rate of change, the same operation used broadly in engineering and physics to express a gradient as an angular measure rather than a raw ratio. Expressing the swing-to-swing move as a percentage change before applying the arctangent function normalizes the calculation across instruments of different absolute price levels, addressing a well-known limitation of naive "price-per-bar" slope measures, which are not comparable between a low-priced and high-priced instrument, or between two different timeframes without adjustment. The optional bar-normalization step draws on the same logic used in rate-of-change and momentum oscillators broadly, where a raw price delta is scaled by the time or bar interval over which it occurred to produce a comparable velocity-style reading rather than a simple magnitude.
The pivot detection mechanism itself is a fractal/symmetric extremum test, a widely used method in swing-structure analysis (related in spirit to Bill Williams' fractal indicator and to classical Dow Theory's emphasis on confirmed swing highs and lows as the building blocks of trend structure) that requires a candidate bar to dominate a defined number of bars on both sides before being accepted as a genuine local extremum. This symmetric confirmation requirement is a standard technique for filtering transient noise out of swing-point identification, at the deliberate cost of confirmation lag, a well-documented trade-off in any lookback-based extremum detection method. The Angle Momentum layer applies a simple moving average — one of the most foundational smoothing techniques in time-series analysis — to the sequence of discrete angle readings themselves rather than to price, effectively treating "swing angle" as its own derived data series and smoothing it the same way a moving average would smooth a price or oscillator series, in order to separate signal (the underlying trend in momentum) from noise (single-swing outliers).
⚠️ Disclaimer
All provided scripts and indicators are strictly for educational exploration and must not be interpreted as financial advice or a recommendation to execute trades. We expressly disclaim all liability for any financial losses or damages that may result, directly or indirectly, from the reliance on or application of these tools. Market participation carries inherent risk where past performance never guarantees future returns, leaving all investment decisions and due diligence solely at your own discretion.

💡 Proprietary indicators. Original research. Built by analysts who trade.
📢 Free Telegram: t.me/MarkitTick_Updates
👑 Premium: TradingView Marketplace
📘 Guides: markittick.com
📢 Free Telegram: t.me/MarkitTick_Updates
👑 Premium: TradingView Marketplace
📘 Guides: markittick.com
Aviso legal
As informações e publicações não se destinam a ser, e não constituem, conselhos ou recomendações financeiras, de investimento, comerciais ou de outro tipo fornecidos ou endossados pela TradingView. Leia mais nos Termos de Uso.
💡 Proprietary indicators. Original research. Built by analysts who trade.
📢 Free Telegram: t.me/MarkitTick_Updates
👑 Premium: TradingView Marketplace
📘 Guides: markittick.com
📢 Free Telegram: t.me/MarkitTick_Updates
👑 Premium: TradingView Marketplace
📘 Guides: markittick.com
Aviso legal
As informações e publicações não se destinam a ser, e não constituem, conselhos ou recomendações financeiras, de investimento, comerciais ou de outro tipo fornecidos ou endossados pela TradingView. Leia mais nos Termos de Uso.