Apex Edge - RSI Trend Lines v2
APEX EDGE · RSI TREND LINES v2
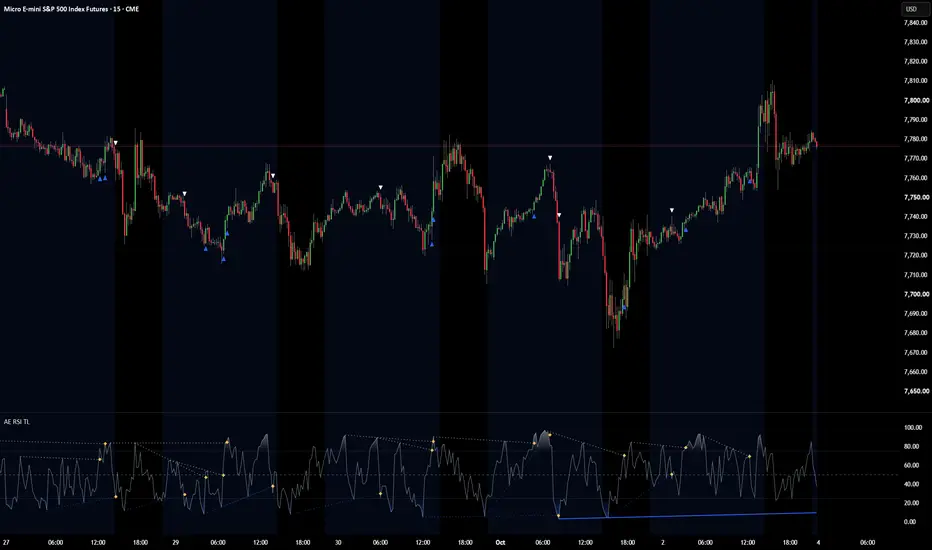
Trend lines drawn on RSI itself, not on price. RSI often breaks its own trend line before price breaks structure, so a line break on RSI is an early sign that momentum is turning.
━━━━━━━━━━━━━━━━━━━━
WHAT'S NEW IN v2
━━━━━━━━━━━━━━━━━━━━
- Rebuilt from scratch in Pine v6.
- Historical lines: broken lines now stay on the pane (faded) so you can review how RSI behaved around past breaks. This was the most requested feature from v1.
- Lines are validated: a line is only drawn if RSI respected it between its two pivots.
- Break markers on the RSI pane, with optional markers on the price chart.
- Alerts through a single "Any alert() function call" alert, plus classic alert conditions.
━━━━━━━━━━━━━━━━━━━━
HOW IT WORKS
━━━━━━━━━━━━━━━━━━━━
- Resistance lines join LOWER RSI highs. Support lines join HIGHER RSI lows ("Trend only" mode). "All slopes" mode joins any two consecutive pivots, as in v1.
- A pivot is confirmed after "Pivot lookback" bars on each side, so every line appears with that delay by design.
- A break = a CLOSED candle with RSI beyond the line. The line stops at the break, a ◆ marks it, and it stays on the pane as history.
- Resistance broken = RSI momentum turning up. Support broken = RSI momentum turning down.
━━━━━━━━━━━━━━━━━━━━
NON-REPAINT
━━━━━━━━━━━━━━━━━━━━
Pivots are confirmed bars after they form, and every line, break and alert commits on closed candles only. What you see on history is what you would have seen live.
━━━━━━━━━━━━━━━━━━━━
SETTINGS
━━━━━━━━━━━━━━━━━━━━
- RSI length and source.
- Pivot lookback (default 10): the setting that matters most. Lower = more lines and earlier breaks; higher = fewer, stronger lines. Many intraday traders run 5 to 6 on the 5m and 15m for faster signals.
- Line type: Trend only / All slopes.
- Extend active lines to the right, max bars between pivots, lines kept per side.
- Keep broken lines, history transparency, colours and widths.
- Upper / lower levels (70 / 30), 50 midline, shading beyond the levels.
- Break markers on the RSI pane and/or price chart.
━━━━━━━━━━━━━━━━━━━━
ALERTS
━━━━━━━━━━━━━━━━━━━━
Create ONE alert on this indicator with "Any alert() function call". The tick boxes in settings choose what it sends:
- RSI broke resistance
- RSI broke support
- New line formed (off by default)
Classic alert conditions for each break are also available. All alerts fire on candle close.
━━━━━━━━━━━━━━━━━━━━
HOW TO USE IT
━━━━━━━━━━━━━━━━━━━━
An RSI line break is a momentum signal, not a trade on its own. It works best as confirmation at a level you already care about: a sweep of a key high or low, a zone, or a session level. Wait for price to reach your level, then use the break in your trade direction as the trigger. Always use a stop.
Each asset runs differently on the chart. Adjust the settings as required until the arrows match up roughly with past price direction.
━━━━━━━━━━━━━━━━━━━━
DISCLAIMER
━━━━━━━━━━━━━━━━━━━━
For education and analysis only. Not financial advice. No indicator predicts the market; past behaviour on a chart does not guarantee future results. Trade at your own risk.
Trend lines drawn on RSI itself, not on price. RSI often breaks its own trend line before price breaks structure, so a line break on RSI is an early sign that momentum is turning.
━━━━━━━━━━━━━━━━━━━━
WHAT'S NEW IN v2
━━━━━━━━━━━━━━━━━━━━
- Rebuilt from scratch in Pine v6.
- Historical lines: broken lines now stay on the pane (faded) so you can review how RSI behaved around past breaks. This was the most requested feature from v1.
- Lines are validated: a line is only drawn if RSI respected it between its two pivots.
- Break markers on the RSI pane, with optional markers on the price chart.
- Alerts through a single "Any alert() function call" alert, plus classic alert conditions.
━━━━━━━━━━━━━━━━━━━━
HOW IT WORKS
━━━━━━━━━━━━━━━━━━━━
- Resistance lines join LOWER RSI highs. Support lines join HIGHER RSI lows ("Trend only" mode). "All slopes" mode joins any two consecutive pivots, as in v1.
- A pivot is confirmed after "Pivot lookback" bars on each side, so every line appears with that delay by design.
- A break = a CLOSED candle with RSI beyond the line. The line stops at the break, a ◆ marks it, and it stays on the pane as history.
- Resistance broken = RSI momentum turning up. Support broken = RSI momentum turning down.
━━━━━━━━━━━━━━━━━━━━
NON-REPAINT
━━━━━━━━━━━━━━━━━━━━
Pivots are confirmed bars after they form, and every line, break and alert commits on closed candles only. What you see on history is what you would have seen live.
━━━━━━━━━━━━━━━━━━━━
SETTINGS
━━━━━━━━━━━━━━━━━━━━
- RSI length and source.
- Pivot lookback (default 10): the setting that matters most. Lower = more lines and earlier breaks; higher = fewer, stronger lines. Many intraday traders run 5 to 6 on the 5m and 15m for faster signals.
- Line type: Trend only / All slopes.
- Extend active lines to the right, max bars between pivots, lines kept per side.
- Keep broken lines, history transparency, colours and widths.
- Upper / lower levels (70 / 30), 50 midline, shading beyond the levels.
- Break markers on the RSI pane and/or price chart.
━━━━━━━━━━━━━━━━━━━━
ALERTS
━━━━━━━━━━━━━━━━━━━━
Create ONE alert on this indicator with "Any alert() function call". The tick boxes in settings choose what it sends:
- RSI broke resistance
- RSI broke support
- New line formed (off by default)
Classic alert conditions for each break are also available. All alerts fire on candle close.
━━━━━━━━━━━━━━━━━━━━
HOW TO USE IT
━━━━━━━━━━━━━━━━━━━━
An RSI line break is a momentum signal, not a trade on its own. It works best as confirmation at a level you already care about: a sweep of a key high or low, a zone, or a session level. Wait for price to reach your level, then use the break in your trade direction as the trigger. Always use a stop.
Each asset runs differently on the chart. Adjust the settings as required until the arrows match up roughly with past price direction.
━━━━━━━━━━━━━━━━━━━━
DISCLAIMER
━━━━━━━━━━━━━━━━━━━━
For education and analysis only. Not financial advice. No indicator predicts the market; past behaviour on a chart does not guarantee future results. Trade at your own risk.

Aviso legal
As informações e publicações não se destinam a ser, e não constituem, conselhos ou recomendações financeiras, de investimento, comerciais ou de outro tipo fornecidos ou endossados pela TradingView. Leia mais nos Termos de Uso.
Aviso legal
As informações e publicações não se destinam a ser, e não constituem, conselhos ou recomendações financeiras, de investimento, comerciais ou de outro tipo fornecidos ou endossados pela TradingView. Leia mais nos Termos de Uso.