OPEN-SOURCE SCRIPT
CVD v2 (Cumulative Volume Delta) + Divergences
🇬🇧 ENGLISH
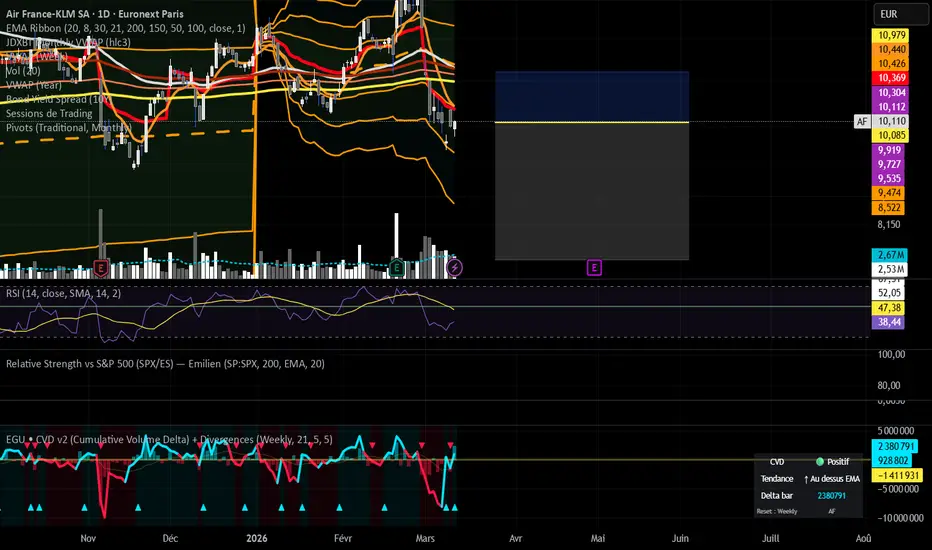
EGU • CVD v2 (Cumulative Volume Delta + Divergences)
The CVD (Cumulative Volume Delta) is an advanced volume indicator that measures in real time the battle between buyers and sellers, bar by bar, by accumulating the volume delta over a defined period.
Unlike classic momentum indicators such as RSI which only analyze price, the CVD analyzes who is truly pushing the market — buyers or sellers — by weighting volume according to the close position within each candle.
Features :
Bar-by-bar delta histogram (instant buying/selling pressure)
Cumulative CVD line with dynamic color based on trend direction
Adjustable CVD EMA to smooth the signal
Automatic detection of bullish and bearish divergences with line drawing
Built-in alerts on divergences and zero-line crossovers
Configurable reset : Never / Weekly / Monthly
Real-time information table (CVD state, trend, current bar delta)
Background coloring based on positive/negative CVD zone
How to use it :
Use CVD divergences in confluence with your Supply & Demand zones to confirm momentum exhaustion before entering a trade
Combine with the RSI : a divergence on both indicators simultaneously is a very strong signal
The zero-line crossover signals a shift in dominance between buyers and sellers
Choose your reset according to your trading style : Weekly for short swing trades (3–14 days), Monthly for longer positions
Recommended settings :
Short swing trading (few days) → Weekly reset, EMA 21
Medium swing trading (2–4 weeks) → Monthly reset, EMA 21
Script created by EGU
Script de código aberto
Em verdadeiro espírito do TradingView, o criador deste script o tornou de código aberto, para que os traders possam revisar e verificar sua funcionalidade. Parabéns ao autor! Embora você possa usá-lo gratuitamente, lembre-se de que a republicação do código está sujeita às nossas Regras da Casa.

Aviso legal
As informações e publicações não se destinam a ser, e não constituem, conselhos ou recomendações financeiras, de investimento, comerciais ou de outro tipo fornecidos ou endossados pela TradingView. Leia mais nos Termos de Uso.
Script de código aberto
Em verdadeiro espírito do TradingView, o criador deste script o tornou de código aberto, para que os traders possam revisar e verificar sua funcionalidade. Parabéns ao autor! Embora você possa usá-lo gratuitamente, lembre-se de que a republicação do código está sujeita às nossas Regras da Casa.
Aviso legal
As informações e publicações não se destinam a ser, e não constituem, conselhos ou recomendações financeiras, de investimento, comerciais ou de outro tipo fornecidos ou endossados pela TradingView. Leia mais nos Termos de Uso.