Nexus Auto Trend Lines
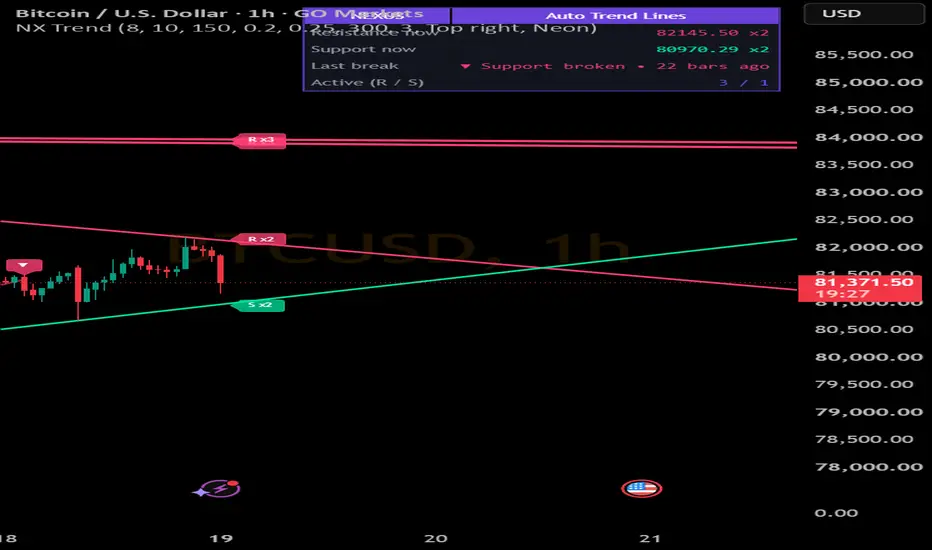
Nexus Auto Trend Lines
WHAT IT DOES
Automatically draws descending trend lines (resistance) and ascending trend lines (support) from confirmed swing points, on every timeframe from 1 minute to 1 year. Nothing to select by hand: lines are found and drawn on the history already loaded on the chart.
HOW IT WORKS
1. Swing highs and lows are confirmed with a pivot length (a swing is confirmed that many bars after it forms).
2. A descending line connects two lower highs. An ascending line connects two higher lows. The line is extended to the right.
3. Optional clean filter: a line is rejected if any bar closed through it between the two swings and now.
4. Touch counting: each later swing within a tolerance (in ATR) of the line adds a touch. The tag at the line end shows "R x3" or "S x2", and lines with 3 or more touches are drawn thicker.
5. Break: a line is broken only when a bar closes beyond it by a margin (in ATR). Then it fades, a small arrow marks the bar, and old lines are removed automatically.
FEATURES
- Auto settings: pivot length, swing distance and line life adapt to the timeframe.
- Four themes (Neon, Classic, Minimal, Mono) plus custom support and resistance colors.
- Small touch-count tags and tiny break arrows with tooltips.
- Dashboard: current resistance and support price with touches, last break, active line count.
- Alerts: new descending line, new ascending line, resistance broken, support broken.
KEY SETTINGS
Pivot length (bigger = fewer, stronger lines), Break margin, Touch tolerance, Keep active lines per side, Reject lines price already cut through, Custom line colors.
NOTES
- Signals use confirmed bars only, so nothing repaints. Lines appear a few bars late because swings need confirmation.
- All distances are in ATR, so it works on forex, gold, indices, stocks and crypto.
- This is a charting tool, not financial advice. Always manage your risk.
WHAT IT DOES
Automatically draws descending trend lines (resistance) and ascending trend lines (support) from confirmed swing points, on every timeframe from 1 minute to 1 year. Nothing to select by hand: lines are found and drawn on the history already loaded on the chart.
HOW IT WORKS
1. Swing highs and lows are confirmed with a pivot length (a swing is confirmed that many bars after it forms).
2. A descending line connects two lower highs. An ascending line connects two higher lows. The line is extended to the right.
3. Optional clean filter: a line is rejected if any bar closed through it between the two swings and now.
4. Touch counting: each later swing within a tolerance (in ATR) of the line adds a touch. The tag at the line end shows "R x3" or "S x2", and lines with 3 or more touches are drawn thicker.
5. Break: a line is broken only when a bar closes beyond it by a margin (in ATR). Then it fades, a small arrow marks the bar, and old lines are removed automatically.
FEATURES
- Auto settings: pivot length, swing distance and line life adapt to the timeframe.
- Four themes (Neon, Classic, Minimal, Mono) plus custom support and resistance colors.
- Small touch-count tags and tiny break arrows with tooltips.
- Dashboard: current resistance and support price with touches, last break, active line count.
- Alerts: new descending line, new ascending line, resistance broken, support broken.
KEY SETTINGS
Pivot length (bigger = fewer, stronger lines), Break margin, Touch tolerance, Keep active lines per side, Reject lines price already cut through, Custom line colors.
NOTES
- Signals use confirmed bars only, so nothing repaints. Lines appear a few bars late because swings need confirmation.
- All distances are in ATR, so it works on forex, gold, indices, stocks and crypto.
- This is a charting tool, not financial advice. Always manage your risk.

Aviso legal
As informações e publicações não se destinam a ser, e não constituem, conselhos ou recomendações financeiras, de investimento, comerciais ou de outro tipo fornecidos ou endossados pela TradingView. Leia mais nos Termos de Uso.
Aviso legal
As informações e publicações não se destinam a ser, e não constituem, conselhos ou recomendações financeiras, de investimento, comerciais ou de outro tipo fornecidos ou endossados pela TradingView. Leia mais nos Termos de Uso.