SW Box MTF
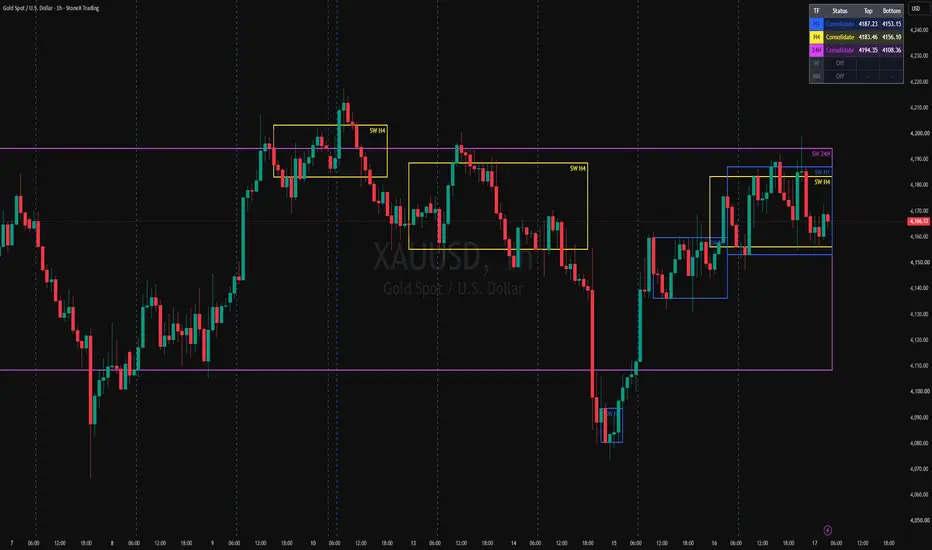
SW Box MTF
OVERVIEW
SW Box MTF automatically draws "SW" consolidation boxes on several higher timeframes at once (H1, H4, 24H, Weekly, Monthly) and displays all of them on any lower-timeframe chart. Each timeframe is tracked independently from its own closed candles, so the boxes do not repaint.
HOW A BOX IS FORMED
The script follows a simple price-cycle sequence on each selected timeframe:
1. Expand – candles of the same color in a row (a directional leg).
2. Stop – the first candle of the opposite color. Small-bodied candles are ignored and never count as a Stop.
3. Retrace – following candles that move in the same direction as the Stop candle.
4. Confirm – a candle of the opposite color to the Retrace confirms the SW box.
The box edges are built from the last close before the Stop plus the Stop, Retrace and confirming candles (using closing prices or full candle bodies, selectable).
HOW A BOX EVOLVES
- A candle that closes inside the box extends it.
- One candle closing outside, followed by a candle back inside, is treated as a false break and the box expands to include it.
- Two consecutive candles closing outside on the same side end the box, and a new cycle begins.
STATUS TABLE
A table shows the current phase and the top/bottom of the latest box for each timeframe:
- Expand ▲ / ▼ – price has broken out of the box and is moving away from it.
- Retrace ▲ / ▼ – a Stop has appeared and price is pulling back.
- Consolidate – price is building inside the SW box.
- Consolidate (1 close above / below) – one candle has closed outside the box; the next candle decides whether the box ends or expands.
- Off / Below chart TF – the timeframe is disabled or lower than the current chart.
SETTINGS
- Choose which timeframes to display and the color of each.
- Small-body threshold (body as % of the candle range).
- Optional rules to fine-tune box detection: minimum Stop + Retrace candles, restarting the box on new extremes, treating deep retracements or strong confirmation candles as a new leg, and extending edges with wicks after confirmation.
- Price Reaches SW Box: enable/disable the alert, choose "Reach by" (Wick or Close) and optionally show "Reached" labels on the chart.
- Number of previous boxes to keep, fill transparency, border width, label size/position and right-side extension.
- Status table on/off, text size and position.
ALERTS
- New SW box (any TF)
- New SW box H1 / H4 / 24H
- SW box ended (any TF)
- Price reached SW box (any TF, or H1 / H4 / 24H) – fires on candle close when price returns to the edge of the latest box after being outside it.
Tip: create the alert with "Any alert() function call" to receive one message that includes the timeframe, the edge reached (top or bottom) and the closing price.
NOTES
- Box timeframes lower than the chart timeframe are disabled automatically.
- For best results, use the indicator on M5–M15 charts to see the H1, H4 and 24H boxes together. Alerts are evaluated on the close of each chart candle.
- This tool is for visual analysis only and does not provide buy or sell signals. Always apply your own risk management.
OVERVIEW
SW Box MTF automatically draws "SW" consolidation boxes on several higher timeframes at once (H1, H4, 24H, Weekly, Monthly) and displays all of them on any lower-timeframe chart. Each timeframe is tracked independently from its own closed candles, so the boxes do not repaint.
HOW A BOX IS FORMED
The script follows a simple price-cycle sequence on each selected timeframe:
1. Expand – candles of the same color in a row (a directional leg).
2. Stop – the first candle of the opposite color. Small-bodied candles are ignored and never count as a Stop.
3. Retrace – following candles that move in the same direction as the Stop candle.
4. Confirm – a candle of the opposite color to the Retrace confirms the SW box.
The box edges are built from the last close before the Stop plus the Stop, Retrace and confirming candles (using closing prices or full candle bodies, selectable).
HOW A BOX EVOLVES
- A candle that closes inside the box extends it.
- One candle closing outside, followed by a candle back inside, is treated as a false break and the box expands to include it.
- Two consecutive candles closing outside on the same side end the box, and a new cycle begins.
STATUS TABLE
A table shows the current phase and the top/bottom of the latest box for each timeframe:
- Expand ▲ / ▼ – price has broken out of the box and is moving away from it.
- Retrace ▲ / ▼ – a Stop has appeared and price is pulling back.
- Consolidate – price is building inside the SW box.
- Consolidate (1 close above / below) – one candle has closed outside the box; the next candle decides whether the box ends or expands.
- Off / Below chart TF – the timeframe is disabled or lower than the current chart.
SETTINGS
- Choose which timeframes to display and the color of each.
- Small-body threshold (body as % of the candle range).
- Optional rules to fine-tune box detection: minimum Stop + Retrace candles, restarting the box on new extremes, treating deep retracements or strong confirmation candles as a new leg, and extending edges with wicks after confirmation.
- Price Reaches SW Box: enable/disable the alert, choose "Reach by" (Wick or Close) and optionally show "Reached" labels on the chart.
- Number of previous boxes to keep, fill transparency, border width, label size/position and right-side extension.
- Status table on/off, text size and position.
ALERTS
- New SW box (any TF)
- New SW box H1 / H4 / 24H
- SW box ended (any TF)
- Price reached SW box (any TF, or H1 / H4 / 24H) – fires on candle close when price returns to the edge of the latest box after being outside it.
Tip: create the alert with "Any alert() function call" to receive one message that includes the timeframe, the edge reached (top or bottom) and the closing price.
NOTES
- Box timeframes lower than the chart timeframe are disabled automatically.
- For best results, use the indicator on M5–M15 charts to see the H1, H4 and 24H boxes together. Alerts are evaluated on the close of each chart candle.
- This tool is for visual analysis only and does not provide buy or sell signals. Always apply your own risk management.

Aviso legal
As informações e publicações não se destinam a ser, e não constituem, conselhos ou recomendações financeiras, de investimento, comerciais ou de outro tipo fornecidos ou endossados pela TradingView. Leia mais nos Termos de Uso.
Aviso legal
As informações e publicações não se destinam a ser, e não constituem, conselhos ou recomendações financeiras, de investimento, comerciais ou de outro tipo fornecidos ou endossados pela TradingView. Leia mais nos Termos de Uso.