OPEN-SOURCE SCRIPT
Candle Body Momentum [UkutaLabs]
█ OVERVIEW
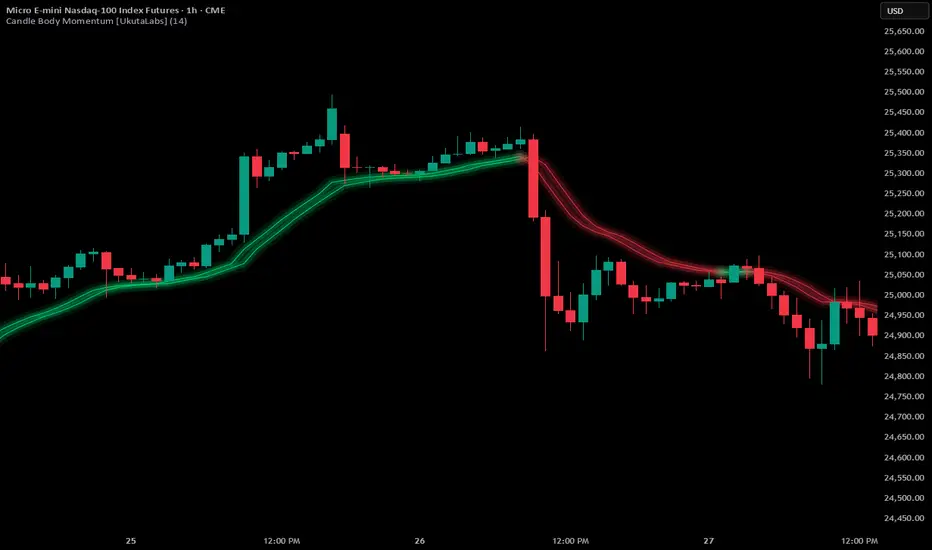
Candle Body Momentum is a price-action driven indicator that measures directional strength by comparing an Exponential Moving Average (EMA) of the closing price against an EMA of the opening price.
Instead of relying on traditional momentum formulas, this tool focuses purely on the candle body — the space between open and close — to reveal which side of the market is in control.
When the EMA of the close is above the EMA of the open, buyers are demonstrating sustained pressure.
When the EMA of the close is below the EMA of the open, sellers are in control.
This simple comparison creates a clean and intuitive view of real directional momentum.
█ HOW IT WORKS
• Calculates an EMA of the closing price
• Calculates an EMA of the opening price
• Compares the two values to determine directional bias
• Displays the relationship visually for quick interpretation
Because candle bodies represent commitment (not just volatility), this method filters out much of the noise created by wicks and intrabar spikes.
█ HOW TO USE
Trend Confirmation
Use Candle Body Momentum to confirm directional bias. If price is trending and the close EMA remains above the open EMA, the trend is supported by sustained buying pressure.
Momentum Shifts
Crossovers between the two EMAs can signal potential shifts in control before traditional moving average systems react.
Pullback Validation
During retracements, watch whether body momentum flips temporarily or remains aligned with the broader trend.
Market Conditions
• Strong separation = strong momentum
• Compression = weakening momentum
• Frequent crossovers = ranging conditions
█ WHY IT’S DIFFERENT
Traditional momentum indicators use mathematical derivatives of price.
Candle Body Momentum focuses on something simpler and often more meaningful:
Who is consistently closing stronger than they opened?
This gives traders a clean, price-driven perspective on directional strength without unnecessary complexity.
Candle Body Momentum is a price-action driven indicator that measures directional strength by comparing an Exponential Moving Average (EMA) of the closing price against an EMA of the opening price.
Instead of relying on traditional momentum formulas, this tool focuses purely on the candle body — the space between open and close — to reveal which side of the market is in control.
When the EMA of the close is above the EMA of the open, buyers are demonstrating sustained pressure.
When the EMA of the close is below the EMA of the open, sellers are in control.
This simple comparison creates a clean and intuitive view of real directional momentum.
█ HOW IT WORKS
• Calculates an EMA of the closing price
• Calculates an EMA of the opening price
• Compares the two values to determine directional bias
• Displays the relationship visually for quick interpretation
Because candle bodies represent commitment (not just volatility), this method filters out much of the noise created by wicks and intrabar spikes.
█ HOW TO USE
Trend Confirmation
Use Candle Body Momentum to confirm directional bias. If price is trending and the close EMA remains above the open EMA, the trend is supported by sustained buying pressure.
Momentum Shifts
Crossovers between the two EMAs can signal potential shifts in control before traditional moving average systems react.
Pullback Validation
During retracements, watch whether body momentum flips temporarily or remains aligned with the broader trend.
Market Conditions
• Strong separation = strong momentum
• Compression = weakening momentum
• Frequent crossovers = ranging conditions
█ WHY IT’S DIFFERENT
Traditional momentum indicators use mathematical derivatives of price.
Candle Body Momentum focuses on something simpler and often more meaningful:
Who is consistently closing stronger than they opened?
This gives traders a clean, price-driven perspective on directional strength without unnecessary complexity.
Script de código aberto
Em verdadeiro espírito do TradingView, o criador deste script o tornou de código aberto, para que os traders possam revisar e verificar sua funcionalidade. Parabéns ao autor! Embora você possa usá-lo gratuitamente, lembre-se de que a republicação do código está sujeita às nossas Regras da Casa.

Aviso legal
As informações e publicações não se destinam a ser, e não constituem, conselhos ou recomendações financeiras, de investimento, comerciais ou de outro tipo fornecidos ou endossados pela TradingView. Leia mais nos Termos de Uso.
Script de código aberto
Em verdadeiro espírito do TradingView, o criador deste script o tornou de código aberto, para que os traders possam revisar e verificar sua funcionalidade. Parabéns ao autor! Embora você possa usá-lo gratuitamente, lembre-se de que a republicação do código está sujeita às nossas Regras da Casa.
Aviso legal
As informações e publicações não se destinam a ser, e não constituem, conselhos ou recomendações financeiras, de investimento, comerciais ou de outro tipo fornecidos ou endossados pela TradingView. Leia mais nos Termos de Uso.