VSA_Accumulation and Distribution_RRR
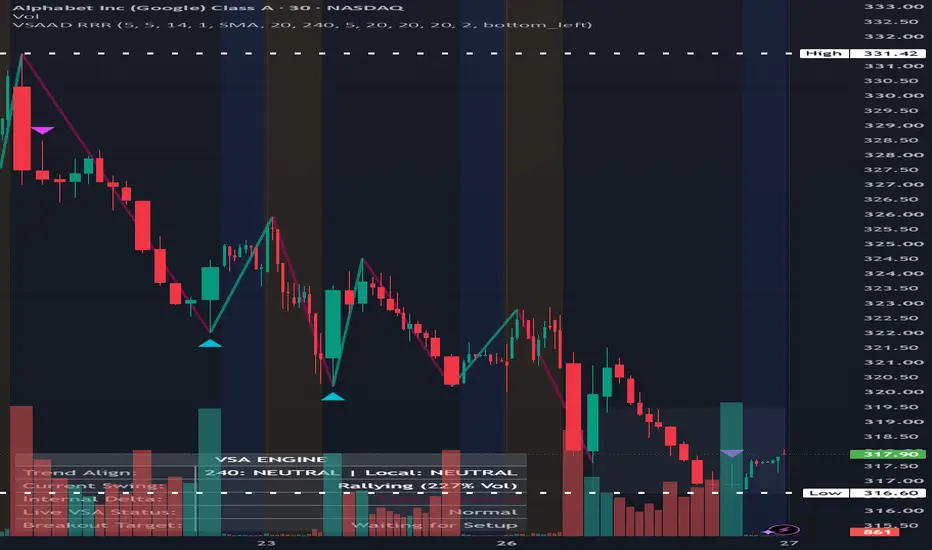
Volume and Structure Analysis - Accumulation and Distribution Indicator
This indicator automates the core principles of Volume Spread Analysis (VSA) as taught by Dr. David Paul, shifting the analytical focus from individual candlesticks to macro swing-leg cumulative volume. By comparing the volume footprint of a live, forming swing against a dynamic historical baseline, it detects institutional Accumulation and Distribution footprints before the price breaks out.
Rather than waiting for a delayed moving average crossover, this script reads the raw effort (volume and intrabar delta) versus the result (price distance) to expose where smart money is positioning.
Key Features
UDT Structural Engine & ATR Filter: Identifies true market structure (Rallies and Drops) using customizable pivot lookbacks. A built-in Average True Range (ATR) threshold filter eliminates choppy consolidation noise, ensuring only structurally significant swings are measured.
Intrabar Delta & Surge Markers: Tracks the buying vs. selling pressure inside the active swing leg. Using Z-score standard deviation math, neon markers point out the exact "Stopping Volume" or "Supply Entry" candlesticks where institutional delta surges abnormally.
Live Formational Tracking: A dynamic chart tracker boxes the currently forming leg in real-time. It instantly updates its state (e.g., "Early Accumulation") if heavy volume absorption is detected before the pivot is even confirmed.
Higher Timeframe (MTF) Gating: Built-in multi-timeframe regime filters ensure that local Accumulation or Distribution breakouts only fire if they align with the broader macro trend (e.g., the 4H chart).
Widget-Style Dashboard: A sleek, non-intrusive UI panel displays HTF/Local trend confluence, active leg volume percentages, live delta control (Buyers vs. Sellers), and exact breakout price targets.
Session-Aware Baseline: Cleanly isolates RTH and ETH volume so that low-liquidity overnight sessions do not skew the historical averages used for VSA comparisons.
How to Trade It
Monitor the Live Leg: Watch the dashboard or the live tracker box for an Accumulation Setup (heavy volume drop) or Distribution Setup (low volume rally).
Look for Delta Confirmation: If the dashboard flags Strong Accumulation (Delta +) or prints a neon Surge Marker, institutions are actively absorbing the move.
Execute the Breakout: The indicator will draw a solid-bordered Setup Zone with the exact price level to watch. Enter when the price physically breaks this boundary and prints the 🚀 ACC BREAKOUT or 🩸 DIST BREAKDOWN label.
This indicator automates the core principles of Volume Spread Analysis (VSA) as taught by Dr. David Paul, shifting the analytical focus from individual candlesticks to macro swing-leg cumulative volume. By comparing the volume footprint of a live, forming swing against a dynamic historical baseline, it detects institutional Accumulation and Distribution footprints before the price breaks out.
Rather than waiting for a delayed moving average crossover, this script reads the raw effort (volume and intrabar delta) versus the result (price distance) to expose where smart money is positioning.
Key Features
UDT Structural Engine & ATR Filter: Identifies true market structure (Rallies and Drops) using customizable pivot lookbacks. A built-in Average True Range (ATR) threshold filter eliminates choppy consolidation noise, ensuring only structurally significant swings are measured.
Intrabar Delta & Surge Markers: Tracks the buying vs. selling pressure inside the active swing leg. Using Z-score standard deviation math, neon markers point out the exact "Stopping Volume" or "Supply Entry" candlesticks where institutional delta surges abnormally.
Live Formational Tracking: A dynamic chart tracker boxes the currently forming leg in real-time. It instantly updates its state (e.g., "Early Accumulation") if heavy volume absorption is detected before the pivot is even confirmed.
Higher Timeframe (MTF) Gating: Built-in multi-timeframe regime filters ensure that local Accumulation or Distribution breakouts only fire if they align with the broader macro trend (e.g., the 4H chart).
Widget-Style Dashboard: A sleek, non-intrusive UI panel displays HTF/Local trend confluence, active leg volume percentages, live delta control (Buyers vs. Sellers), and exact breakout price targets.
Session-Aware Baseline: Cleanly isolates RTH and ETH volume so that low-liquidity overnight sessions do not skew the historical averages used for VSA comparisons.
How to Trade It
Monitor the Live Leg: Watch the dashboard or the live tracker box for an Accumulation Setup (heavy volume drop) or Distribution Setup (low volume rally).
Look for Delta Confirmation: If the dashboard flags Strong Accumulation (Delta +) or prints a neon Surge Marker, institutions are actively absorbing the move.
Execute the Breakout: The indicator will draw a solid-bordered Setup Zone with the exact price level to watch. Enter when the price physically breaks this boundary and prints the 🚀 ACC BREAKOUT or 🩸 DIST BREAKDOWN label.

Aviso legal
As informações e publicações não se destinam a ser, e não constituem, conselhos ou recomendações financeiras, de investimento, comerciais ou de outro tipo fornecidos ou endossados pela TradingView. Leia mais nos Termos de Uso.
Aviso legal
As informações e publicações não se destinam a ser, e não constituem, conselhos ou recomendações financeiras, de investimento, comerciais ou de outro tipo fornecidos ou endossados pela TradingView. Leia mais nos Termos de Uso.