OPEN-SOURCE SCRIPT
c-c/MA (Simplified 2-Color)
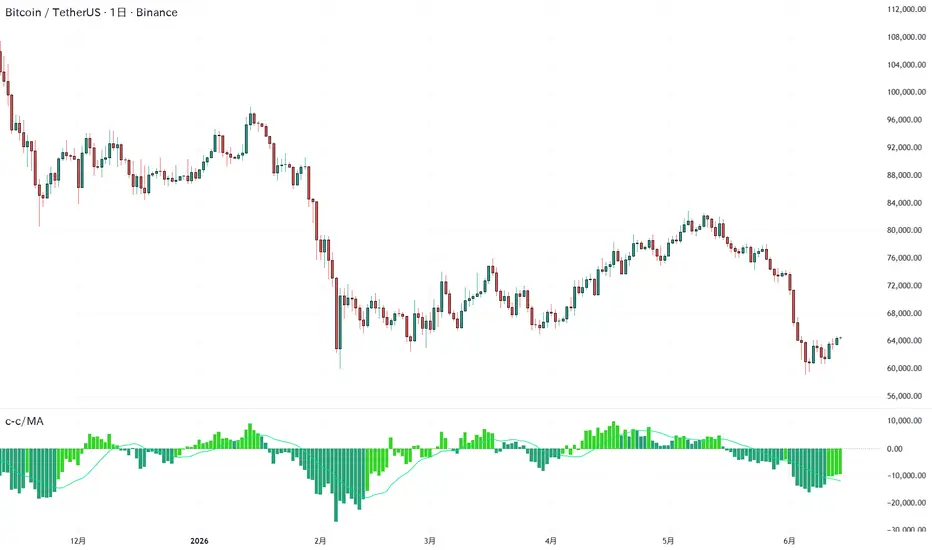
c-c/MA (Simplified 2-Color)
This indicator is a simple momentum analysis tool that visualizes price movement by comparing the current price with the price from a specified number of periods ago.
It displays the price difference as a histogram and applies a Simple Moving Average (SMA) to help identify trend strength and momentum shifts.
Features
Price Difference (c-c)
The indicator calculates the difference between the current closing price and the closing price from a specified number of bars ago:
* Positive values indicate that the current price is higher than the past price.
* Negative values indicate that the current price is lower than the past price.
SMA Smoothing
A Simple Moving Average (SMA) is applied to the histogram to smooth short-term fluctuations and highlight the overall momentum trend.
Two-Color Histogram
The histogram changes color based on its relationship to the SMA:
* Above SMA: Indicates relatively stronger momentum.
* Below SMA: Indicates weaker or slowing momentum.
Zero Line
The zero line represents the point where the current price equals the price from the selected lookback period:
* Above zero: Bullish momentum.
* Below zero: Bearish momentum.
How to Use
This indicator can be used to:
* Identify trend direction
* Evaluate momentum strength
* Detect potential trend shifts
* Complement other indicators such as RSI, volume analysis, or moving averages
Note: This indicator is designed as a supporting analytical tool and should be used alongside other forms of market analysis and risk management.
This indicator is a simple momentum analysis tool that visualizes price movement by comparing the current price with the price from a specified number of periods ago.
It displays the price difference as a histogram and applies a Simple Moving Average (SMA) to help identify trend strength and momentum shifts.
Features
Price Difference (c-c)
The indicator calculates the difference between the current closing price and the closing price from a specified number of bars ago:
* Positive values indicate that the current price is higher than the past price.
* Negative values indicate that the current price is lower than the past price.
SMA Smoothing
A Simple Moving Average (SMA) is applied to the histogram to smooth short-term fluctuations and highlight the overall momentum trend.
Two-Color Histogram
The histogram changes color based on its relationship to the SMA:
* Above SMA: Indicates relatively stronger momentum.
* Below SMA: Indicates weaker or slowing momentum.
Zero Line
The zero line represents the point where the current price equals the price from the selected lookback period:
* Above zero: Bullish momentum.
* Below zero: Bearish momentum.
How to Use
This indicator can be used to:
* Identify trend direction
* Evaluate momentum strength
* Detect potential trend shifts
* Complement other indicators such as RSI, volume analysis, or moving averages
Note: This indicator is designed as a supporting analytical tool and should be used alongside other forms of market analysis and risk management.
Script de código aberto
Em verdadeiro espírito do TradingView, o criador deste script o tornou de código aberto, para que os traders possam revisar e verificar sua funcionalidade. Parabéns ao autor! Embora você possa usá-lo gratuitamente, lembre-se de que a republicação do código está sujeita às nossas Regras da Casa.

Aviso legal
As informações e publicações não se destinam a ser, e não constituem, conselhos ou recomendações financeiras, de investimento, comerciais ou de outro tipo fornecidos ou endossados pela TradingView. Leia mais nos Termos de Uso.
Script de código aberto
Em verdadeiro espírito do TradingView, o criador deste script o tornou de código aberto, para que os traders possam revisar e verificar sua funcionalidade. Parabéns ao autor! Embora você possa usá-lo gratuitamente, lembre-se de que a republicação do código está sujeita às nossas Regras da Casa.
Aviso legal
As informações e publicações não se destinam a ser, e não constituem, conselhos ou recomendações financeiras, de investimento, comerciais ou de outro tipo fornecidos ou endossados pela TradingView. Leia mais nos Termos de Uso.