Saturation Peak Detection [PhenLabs]
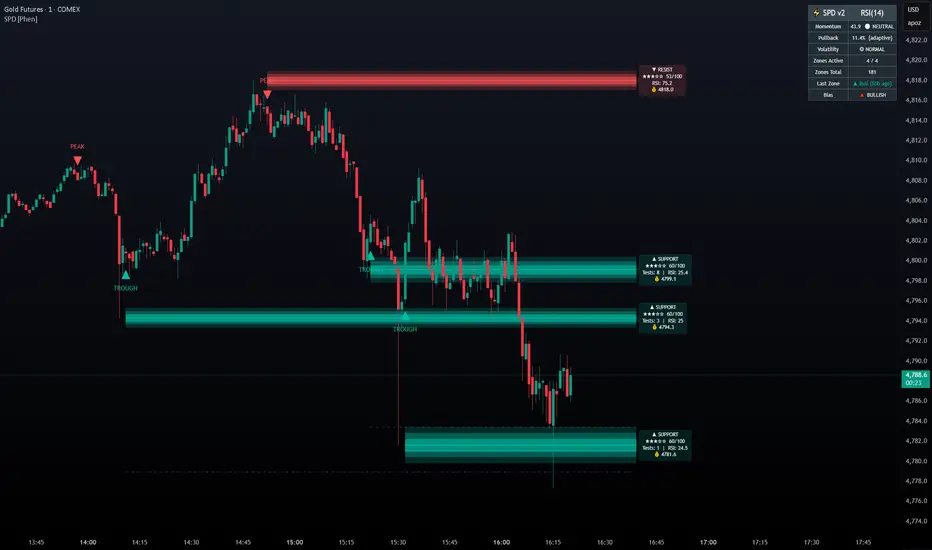
📊 Saturation Peak Detection [PhenLabs]
v1.0 — S/R zones planted only when momentum peaks and pulls back — no sweep noise, only saturation-confirmed structure

📌 OVERVIEW
Saturation Peak Detection (SPD) plants support and resistance zones only at price levels where a momentum proxy has demonstrably exhausted. Most S/R tools mark every swing pivot — SPD adds a mandatory saturation gate: a zone only forms when the momentum proxy (RSI, ROC, or MFI) has peaked within a lookback window and then pulled back by a configurable % from that peak. If momentum hasn’t saturated, no zone is drawn.
The result is a smaller set of higher-conviction structural levels, each backed by a quantifiable momentum exhaustion event — easier to audit, easier to trust.
HOW IT WORKS
* Rolling Peak and Trough Tracking
* Saturation Trigger
* Latch + Cooldown System
* Zone Management
🔑 POINTS OF INNOVATION
🔧 SETTINGS
Momentum Proxy
Saturation Trigger
Zone Settings
Display
Colors
🔥 ALERTS
🎨 VISUAL GUIDE
📖 USAGE NOTES
✅ WORKS WELL WITH
v1.0 — S/R zones planted only when momentum peaks and pulls back — no sweep noise, only saturation-confirmed structure
📌 OVERVIEW
Saturation Peak Detection (SPD) plants support and resistance zones only at price levels where a momentum proxy has demonstrably exhausted. Most S/R tools mark every swing pivot — SPD adds a mandatory saturation gate: a zone only forms when the momentum proxy (RSI, ROC, or MFI) has peaked within a lookback window and then pulled back by a configurable % from that peak. If momentum hasn’t saturated, no zone is drawn.
The result is a smaller set of higher-conviction structural levels, each backed by a quantifiable momentum exhaustion event — easier to audit, easier to trust.
HOW IT WORKS
- Momentum Proxy Computation
- Choose RSI, ROC (Rate of Change), or MFI (Money Flow Index) — all standard, public-domain oscillators
- The selected proxy is computed over a configurable length (default: 14 bars)
- An optional second-pane plot shows the raw momentum series, rolling peak, and rolling trough for visual reference
* Rolling Peak and Trough Tracking
- Rolling peak: highest momentum value within the last N bars (configurable Peak Lookback)
- Rolling trough: lowest momentum value within the same window
- The price at the bar of the peak/trough is stored as the zone anchor
* Saturation Trigger
- Bear saturation: momentum drops ≥ Pullback % below its rolling peak → resistance zone planted at the peak-bar’s price
- Bull saturation: momentum recovers ≥ Pullback % above its rolling trough → support zone planted at the trough-bar’s price
- All triggers gated on barstate.isconfirmed — no intrabar firing, no repainting
* Latch + Cooldown System
- Each unique peak/trough can only create one zone — the latch tracks the bar index of the last-used peak/trough and blocks a re-trigger on the same event
- A configurable Zone Cooldown (default: 10 bars) enforces a minimum spacing between any two zone creations
- Together these prevent consecutive-bar spam and cluster stacking
* Zone Management
- Each zone is an ATR-wide filled rectangle centered on the anchor price — context-relative thickness
- A dashed invalidation line sits at a configurable offset beyond the zone boundary
- When price closes past the invalidation line, the zone is greyed out (non-destructive — stays visible for audit)
- Maximum active zones cap (default: 3) with oldest-valid-first eviction
🔑 POINTS OF INNOVATION
- Saturation gate: zones require quantified momentum exhaustion, not just a price pivot — fundamentally different from standard S/R tools
- Three interchangeable proxies: RSI, ROC, MFI — swap based on market type (RSI for equities/crypto, ROC for pure momentum, MFI for volume-heavy instruments)
- Peak-price anchoring: the zone is planted at the price of the momentum peak bar, not the trigger bar — precise anchor to where buyers/sellers actually exhausted
- Single-concept extractability: clean, auditable logic with one mechanism — easy to backtest, explain, and extend
- Non-destructive invalidation: invalidated zones stay visible in grey, preserving historical structure context without cluttering the active signal layer
🔧 SETTINGS
Momentum Proxy
- Momentum Source | Default: RSI | Options: RSI, ROC, MFI
- Momentum Length | Default: 14 | Range: 2–100
- Peak Lookback (bars) | Default: 50 | Range: 5–300 | Window for detecting rolling peak/trough
Saturation Trigger
- Pullback % from Peak | Default: 10.0 | Range: 1.0–50.0 | Momentum must pull back this % to confirm saturation. Higher = rarer, stronger zones
- Zone Cooldown (bars) | Default: 10 | Range: 0–100 | Minimum bars between zone creations
Zone Settings
- Max Active Zones | Default: 3 | Range: 1–10
- ATR Length | Default: 14 | Used to compute zone height
- Invalidation Offset (%) | Default: 0.3 | Zone is invalidated when price closes this % beyond the outer boundary
Display
- Show Momentum Line (Pane 2) | Default: ON | Plots momentum proxy + rolling peak/trough in a separate pane
- Show Zone Labels | Default: ON | Labels show zone type and momentum value at peak
Colors
- Support Zone, Resistance Zone, Invalidation Line, Trigger Marker — all fully customizable
🔥 ALERTS
- SPD — Bear Saturation Zone: fires when a resistance zone is planted (momentum peaked, pullback confirmed)
- SPD — Bull Saturation Zone: fires when a support zone is planted (momentum troughed, recovery confirmed)
🎨 VISUAL GUIDE
- Teal filled rectangle = active support zone (bull saturation confirmed)
- Red filled rectangle = active resistance zone (bear saturation confirmed)
- Grey filled rectangle = invalidated zone (price closed beyond invalidation line)
- Dashed grey line = invalidation level for each zone
- Orange triangles = saturation trigger markers (▲ below bar = bull, ▼ above bar = bear)
- Purple line (pane 2) = raw momentum proxy
- Red step line (pane 2) = rolling peak | Teal step line (pane 2) = rolling trough
📖 USAGE NOTES
- Designed for 1H, 4H, and Daily timeframes — where momentum exhaustion is most structurally significant
- RSI works best on equities and crypto where overbought/oversold levels are well-studied
- ROC is better for pure price momentum without smoothing — use on trending futures and forex pairs
- MFI adds volume confirmation — best on high-volume instruments where volume leads price
- Increase Pullback % to 15–20% for fewer, higher-conviction zones; reduce to 5–8% for more frequent signals on lower timeframes
- The zone anchor is the price at the momentum peak bar — this is the level where participants exhausted, not the trigger bar
- Use the dashed invalidation line as a hard stop reference — a close beyond it means the zone has been absorbed
✅ WORKS WELL WITH
- Volume Profile tools (confirm zone with high-volume nodes)
- VWAP / Anchored VWAP (zone + VWAP confluence = stronger level)
- Trend filters (EMA, Supertrend) for directional bias before entering at a zone
- ATR-based position sizing (zone width already ATR-scaled — align stop to invalidation line)
⚠️ DISCLAIMER
This indicator is for educational and research purposes only. It is not financial advice and does not constitute a trading recommendation. Past performance does not guarantee future results. Always conduct your own analysis before making any trading or investment decision.

TradingView Charting w/ Crypto Systems: phenlabs.com
Join our growing community: discord.gg/phen
All content provided by PhenLabs is for informational & educational purposes only. Past performance does not guarantee future results.
Join our growing community: discord.gg/phen
All content provided by PhenLabs is for informational & educational purposes only. Past performance does not guarantee future results.
Aviso legal
As informações e publicações não se destinam a ser, e não constituem, conselhos ou recomendações financeiras, de investimento, comerciais ou de outro tipo fornecidos ou endossados pela TradingView. Leia mais nos Termos de Uso.
TradingView Charting w/ Crypto Systems: phenlabs.com
Join our growing community: discord.gg/phen
All content provided by PhenLabs is for informational & educational purposes only. Past performance does not guarantee future results.
Join our growing community: discord.gg/phen
All content provided by PhenLabs is for informational & educational purposes only. Past performance does not guarantee future results.
Aviso legal
As informações e publicações não se destinam a ser, e não constituem, conselhos ou recomendações financeiras, de investimento, comerciais ou de outro tipo fornecidos ou endossados pela TradingView. Leia mais nos Termos de Uso.