OPEN-SOURCE SCRIPT
Atualizado ADX/DI Volume Profile
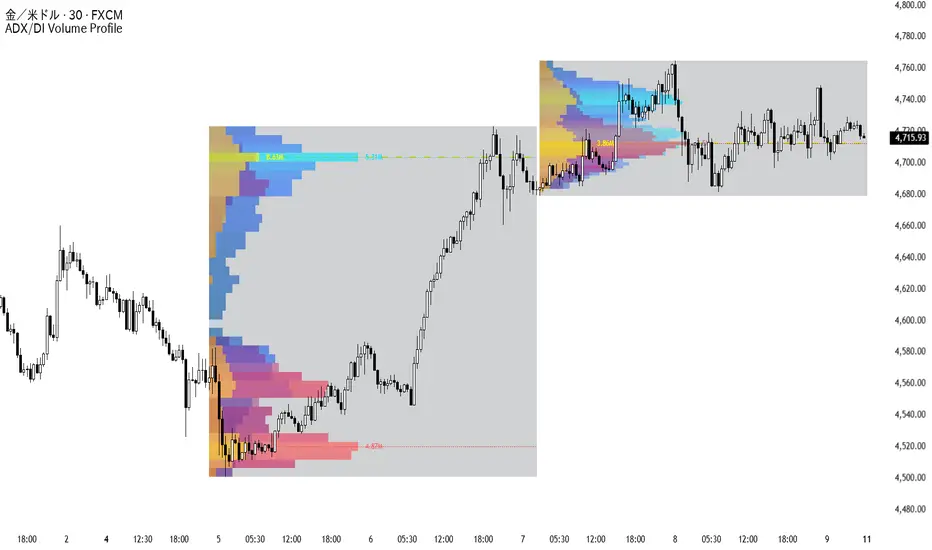
ADX/DI Volume Profile
Hello everyone. Please excuse my English, as I am not a native speaker. I use translation tools, but I hope my passion for coding reaches you.
First of all, I want to express my deepest respect and gratitude to @LuxAlgo. Your incredibly creative scripts and stunning visual designs have always been a huge inspiration to my coding journey. Thank you!
[ Overview ]
Usually, ADX and DMI are drawn at the bottom of the chart to show when a trend is strong. But I wanted to know where (at what price) the trend was the strongest.
This script creates a "Spatial Energy Memory." It stacks buying and selling power not by time, but by price levels, and in this "Ultimate" version, it perfectly fuses Volume (market heat) with momentum.
[ How it Calculates ]
Making Boxes:
We take the highest and lowest price of a fixed period and divide that space into equal rows.
Storing Energy (Volume Weighted):
If a candle passes through 5 rows, we calculate the ADX/DI momentum and multiply it by the Volume of that specific candle. The explosive "heat" of the market is then shared into those 5 rows.
Drawing Blocks:
The price row with the highest total points gets the longest block on the chart.
[ How to Read the Chart ]
Blue Walls (+DI):
Strong buying energy and volume. Acts as a powerful support.
Red Walls (-DI):
Strong selling energy and volume. Acts as a heavy resistance.
ADX POC (Yellow Dashed Line):
The exact price where the trend energy exploded the most.
Local VWAP & Fibonacci:
Displays the Volume Weighted Average Price within the session, along with clean, non-obtrusive Fibonacci levels to identify dynamic support/resistance.

[ Key Features & Optimizations ]
Fixed Steps Engine (Zero Repaint):
To ensure maximum reliability for real-time trading, this indicator locks the profile frames into fixed past sessions. The boundaries never shift, meaning your support/resistance levels are absolute and will never repaint.
Performance Optimized:
TradingView has a strict limit of 500 drawings per script. To prevent visual bugs and missing blocks, I have hard-capped the resolution to a maximum of 40 rows and 3 historical sessions. This ensures a highly stable and beautiful display, effectively preventing common visual glitches.
Streamlined Layouts:
Choose from Left, Right, or Center Aligned. You can independently set the layout for +DI, -DI, and ADX to create beautiful "Mirror" or "Butterfly" setups.
Noise Filter:
By increasing the Noise Filter, weak and transparent energy blocks are automatically stripped away, leaving only the true, thick walls of the market.
Enjoy the ultimate spatial view of the market!
(Japanese )
皆さんこんにちは。私は英語のネイティブスピーカーではないため、至らない表現があるかもしれませんが、このスクリプトに込めた熱意が皆様に伝われば嬉しいです。
まず初めに、LuxAlgo氏へ最大限の敬意と感謝を捧げます。あなたの驚くべきスクリプトと洗練された視覚的デザインは、私のコーディングの旅において常に巨大なインスピレーションの源でした。本当にありがとうございます。
[ 概要 ]
通常、ADXやDMIはチャートの下部に表示され、「いつ」トレンドが強かったかを示します。しかし、私は「どの価格帯で」トレンドが最も強かったかを知りたいと考えました。
このスクリプトは時間軸ではなく価格帯(空間)ごとにパワーを積み上げ、さらに出来高(相場の熱量)を完全に融合させた「エネルギーの記憶」を描き出します。
[ 計算のロジック ]
箱を作る: 一定期間の最高値と最安値を取り、その空間を等間隔の行に分割します。
エネルギーを配分する(出来高補正): ローソク足が5つの箱を通過した場合、その時のADX/DIのモメンタムに出来高を掛け合わせます。大口が本気で叩いてきた「熱量」が、5つの箱に配分されます。
ブロックを描画する: 最終的に最も多くポイントが蓄積された価格帯に、最も長いブロックを描画します。
[ チャートの見方 ]
青い壁(+DI)/ 赤い壁(-DI): 強い買い(または売り)エネルギーと出来高が蓄積された場所です。強力なサポート/レジスタンスとして機能します。
ADX POC(黄色の破線): トレンドの勢いが最も爆発したコアとなる価格帯です。
Local VWAP & フィボナッチ: 期間内のVWAP(出来高加重平均価格)と、視界を邪魔しない洗練されたフィボナッチを表示します。
[ 主要機能と最適化 ]
完全固定エンジン(リペイントなし): 実戦トレードでの信頼性を極限まで高めるため、プロファイルの枠組みは過去の一定期間で完全にロックされます。基準枠がズレたりリペイントしたりすることは一切なく、描画された壁は絶対的な基準として機能します。
パフォーマンス最適化(バグ防止): TradingViewの「最大500個の描画制限」による表示崩れを完全に防ぐため、解像度(最大40分割)と表示数(最大3セッション)に安全装置となる上限を設けています。これにより、システムの限界による表示崩れを未然に防ぎ、いかなる相場でも極めて安定した美しい表示を実現します。
洗練されたレイアウト: +DI、-DI、ADXの配置を独立して設定でき、買いと売りを反発させる「ミラー配置」なども自由に構築可能です。
ノイズフィルター: フィルターの数値を上げると、エネルギーの弱い透明なブロックが自動的に削ぎ落とされ、本当に意識される「分厚い壁」だけを残すことができます。
空間的な市場分析をお楽しみください!
Hello everyone. Please excuse my English, as I am not a native speaker. I use translation tools, but I hope my passion for coding reaches you.
First of all, I want to express my deepest respect and gratitude to @LuxAlgo. Your incredibly creative scripts and stunning visual designs have always been a huge inspiration to my coding journey. Thank you!
[ Overview ]
Usually, ADX and DMI are drawn at the bottom of the chart to show when a trend is strong. But I wanted to know where (at what price) the trend was the strongest.
This script creates a "Spatial Energy Memory." It stacks buying and selling power not by time, but by price levels, and in this "Ultimate" version, it perfectly fuses Volume (market heat) with momentum.
[ How it Calculates ]
Making Boxes:
We take the highest and lowest price of a fixed period and divide that space into equal rows.
Storing Energy (Volume Weighted):
If a candle passes through 5 rows, we calculate the ADX/DI momentum and multiply it by the Volume of that specific candle. The explosive "heat" of the market is then shared into those 5 rows.
Drawing Blocks:
The price row with the highest total points gets the longest block on the chart.
[ How to Read the Chart ]
Blue Walls (+DI):
Strong buying energy and volume. Acts as a powerful support.
Red Walls (-DI):
Strong selling energy and volume. Acts as a heavy resistance.
ADX POC (Yellow Dashed Line):
The exact price where the trend energy exploded the most.
Local VWAP & Fibonacci:
Displays the Volume Weighted Average Price within the session, along with clean, non-obtrusive Fibonacci levels to identify dynamic support/resistance.
[ Key Features & Optimizations ]
Fixed Steps Engine (Zero Repaint):
To ensure maximum reliability for real-time trading, this indicator locks the profile frames into fixed past sessions. The boundaries never shift, meaning your support/resistance levels are absolute and will never repaint.
Performance Optimized:
TradingView has a strict limit of 500 drawings per script. To prevent visual bugs and missing blocks, I have hard-capped the resolution to a maximum of 40 rows and 3 historical sessions. This ensures a highly stable and beautiful display, effectively preventing common visual glitches.
Streamlined Layouts:
Choose from Left, Right, or Center Aligned. You can independently set the layout for +DI, -DI, and ADX to create beautiful "Mirror" or "Butterfly" setups.
Noise Filter:
By increasing the Noise Filter, weak and transparent energy blocks are automatically stripped away, leaving only the true, thick walls of the market.
Enjoy the ultimate spatial view of the market!
(Japanese )
皆さんこんにちは。私は英語のネイティブスピーカーではないため、至らない表現があるかもしれませんが、このスクリプトに込めた熱意が皆様に伝われば嬉しいです。
まず初めに、LuxAlgo氏へ最大限の敬意と感謝を捧げます。あなたの驚くべきスクリプトと洗練された視覚的デザインは、私のコーディングの旅において常に巨大なインスピレーションの源でした。本当にありがとうございます。
[ 概要 ]
通常、ADXやDMIはチャートの下部に表示され、「いつ」トレンドが強かったかを示します。しかし、私は「どの価格帯で」トレンドが最も強かったかを知りたいと考えました。
このスクリプトは時間軸ではなく価格帯(空間)ごとにパワーを積み上げ、さらに出来高(相場の熱量)を完全に融合させた「エネルギーの記憶」を描き出します。
[ 計算のロジック ]
箱を作る: 一定期間の最高値と最安値を取り、その空間を等間隔の行に分割します。
エネルギーを配分する(出来高補正): ローソク足が5つの箱を通過した場合、その時のADX/DIのモメンタムに出来高を掛け合わせます。大口が本気で叩いてきた「熱量」が、5つの箱に配分されます。
ブロックを描画する: 最終的に最も多くポイントが蓄積された価格帯に、最も長いブロックを描画します。
[ チャートの見方 ]
青い壁(+DI)/ 赤い壁(-DI): 強い買い(または売り)エネルギーと出来高が蓄積された場所です。強力なサポート/レジスタンスとして機能します。
ADX POC(黄色の破線): トレンドの勢いが最も爆発したコアとなる価格帯です。
Local VWAP & フィボナッチ: 期間内のVWAP(出来高加重平均価格)と、視界を邪魔しない洗練されたフィボナッチを表示します。
[ 主要機能と最適化 ]
完全固定エンジン(リペイントなし): 実戦トレードでの信頼性を極限まで高めるため、プロファイルの枠組みは過去の一定期間で完全にロックされます。基準枠がズレたりリペイントしたりすることは一切なく、描画された壁は絶対的な基準として機能します。
パフォーマンス最適化(バグ防止): TradingViewの「最大500個の描画制限」による表示崩れを完全に防ぐため、解像度(最大40分割)と表示数(最大3セッション)に安全装置となる上限を設けています。これにより、システムの限界による表示崩れを未然に防ぎ、いかなる相場でも極めて安定した美しい表示を実現します。
洗練されたレイアウト: +DI、-DI、ADXの配置を独立して設定でき、買いと売りを反発させる「ミラー配置」なども自由に構築可能です。
ノイズフィルター: フィルターの数値を上げると、エネルギーの弱い透明なブロックが自動的に削ぎ落とされ、本当に意識される「分厚い壁」だけを残すことができます。
空間的な市場分析をお楽しみください!
Notas de Lançamento
Hello everyone. First of all, I want to express my deepest respect and gratitude to @LuxAlgo. Your incredibly creative scripts and stunning visual designs have always been a huge inspiration to my coding journey. Thank you!◼️ Overview
Usually, ADX and DMI are oscillators drawn at the bottom of the chart to show *when* a trend is strong. This "Ultimate" script creates a "Spatial Energy Memory" by completely fusing price levels, volume, and momentum. It visualizes exactly *where* the trend was strongest by stacking volume-weighted directional energy onto the Y-axis.
◼️ Underlying Concepts & Advanced Calculations
This script replaces temporal accumulation with a highly advanced spatial distribution using the following mathematical logic:
1. Price Segmentation: The script takes the highest and lowest price of a fixed session and divides the vertical space into equal rows.
2. Volume & Dominance Weighting: Unlike standard profiles, this script calculates a Directional Dominance Ratio ($\Delta DI_{ratio}$) to amplify the weight of strong trends. The energy distributed to the touched price rows is calculated as:
 ENERGY = DI \times Volume \times (1 + \frac{|+DI - -DI|}{+DI + -DI})$
This ensures that price levels where large volume aligns with high directional dominance (large spread between +DI and -DI) are heavily emphasized as true institutional walls.
3. VWAP & Dynamic Fibonacci: The script calculates the anchored Volume Weighted Average Price (VWAP) for the fixed session: $\frac{\sum (Typical Price \times Volume)}{\sum Volume}$. Furthermore, it dynamically projects Fibonacci levels anchored from this VWAP to the session's extremes, providing clean, non-obtrusive S/R bands.
◼️ How to Read & Trade
- Blue Walls (+DI) & Red Walls (-DI): Highlight price zones where strong buying/selling momentum perfectly aligned with massive volume. These act as definitive support/resistance zones.
- ADX POC (Yellow Dashed Line): The core price level where trend energy exploded the most.
- VWAP & Fibs: Price interacting with the VWAP or Fib levels inside the thick profile walls offers high-probability bounce setups.
◼️ Key Features & Platform Optimization
- Engine Mode (Zero Repaint): Profile frames are locked into historical sessions, guaranteeing that established walls and VWAP/Fib levels will never repaint, ensuring maximum reliability for real-time entries.
- Strict Performance Optimization: TradingView has a strict limit of 500 drawing objects per script. To guarantee absolute stability and prevent any visual glitches/missing blocks under extreme volatility, this script employs a strict architectural hard-cap (max 40 resolution rows & 3 historical sessions).
- Noise Filter: Automatically strips away weak, transparent blocks based on a user-defined threshold, leaving only the "true walls" of the market.
[Important Notice]
Please excuse my English, as I am not a native speaker. I use translation tools, but I hope my passion for coding reaches you.
Notas de Lançamento
Correction: Fixed text formatting issues in the mathematical formulas from the previous release note.Hello everyone. First of all, I want to express my deepest respect and gratitude to @LuxAlgo. Your incredibly creative scripts and stunning visual designs have always been a huge inspiration to my coding journey. Thank you!
◼️ Overview
Usually, ADX and DMI are oscillators drawn at the bottom of the chart to show *when* a trend is strong. This "Ultimate" script creates a "Spatial Energy Memory" by completely fusing price levels, volume, and momentum. It visualizes exactly *where* the trend was strongest by stacking volume-weighted directional energy onto the Y-axis.
◼️ Underlying Concepts & Advanced Calculations
This script replaces temporal accumulation with a highly advanced spatial distribution using the following mathematical logic:
1. Price Segmentation: The script takes the highest and lowest price of a fixed session and divides the vertical space into equal rows.
2. Volume & Dominance Weighting: Unlike standard profiles, this script calculates a Directional Dominance Ratio (Delta DI Ratio) to amplify the weight of strong trends. The energy distributed to the touched price rows is calculated as:
[ ENERGY = DI * Volume * (1 + |+DI - -DI| / (+DI + -DI)) ]
This ensures that price levels where large volume aligns with high directional dominance (large spread between +DI and -DI) are heavily emphasized as true institutional walls.
3. VWAP & Dynamic Fibonacci: The script calculates the anchored Volume Weighted Average Price (VWAP) for the fixed session: [ Sum of (Typical Price * Volume) / Sum of Volume ]. Furthermore, it dynamically projects Fibonacci levels anchored from this VWAP to the session's extremes, providing clean, non-obtrusive S/R bands.
◼️ How to Read & Trade
- Blue Walls (+DI) & Red Walls (-DI): Highlight price zones where strong buying/selling momentum perfectly aligned with massive volume. These act as definitive support/resistance zones.
- ADX POC (Yellow Dashed Line): The core price level where trend energy exploded the most.
- VWAP & Fibs: Price interacting with the VWAP or Fib levels inside the thick profile walls offers high-probability bounce setups.
◼️ Key Features & Platform Optimization
- Engine Mode (Zero Repaint): Profile frames are locked into historical sessions, guaranteeing that established walls and VWAP/Fib levels will never repaint, ensuring maximum reliability for real-time entries.
- Strict Performance Optimization: TradingView has a strict limit of 500 drawing objects per script. To guarantee absolute stability and prevent any visual glitches/missing blocks under extreme volatility, this script employs a strict architectural hard-cap (max 40 resolution rows & 3 historical sessions).
- Noise Filter: Automatically strips away weak, transparent blocks based on a user-defined threshold, leaving only the "true walls" of the market.
[Important Notice]
Please excuse my English, as I am not a native speaker. I use translation tools, but I hope my passion for coding reaches you.
Script de código aberto
Em verdadeiro espírito do TradingView, o criador deste script o tornou de código aberto, para que os traders possam revisar e verificar sua funcionalidade. Parabéns ao autor! Embora você possa usá-lo gratuitamente, lembre-se de que a republicação do código está sujeita às nossas Regras da Casa.

Script Developer.
I specialize in pushing basic, fundamental concepts to their absolute limits. Dedicated to engineering noise-free indicators that reveal true market mechanics and logical edges. Clarity over
I specialize in pushing basic, fundamental concepts to their absolute limits. Dedicated to engineering noise-free indicators that reveal true market mechanics and logical edges. Clarity over
Aviso legal
As informações e publicações não se destinam a ser, e não constituem, conselhos ou recomendações financeiras, de investimento, comerciais ou de outro tipo fornecidos ou endossados pela TradingView. Leia mais nos Termos de Uso.
Script de código aberto
Em verdadeiro espírito do TradingView, o criador deste script o tornou de código aberto, para que os traders possam revisar e verificar sua funcionalidade. Parabéns ao autor! Embora você possa usá-lo gratuitamente, lembre-se de que a republicação do código está sujeita às nossas Regras da Casa.
Script Developer.
I specialize in pushing basic, fundamental concepts to their absolute limits. Dedicated to engineering noise-free indicators that reveal true market mechanics and logical edges. Clarity over
I specialize in pushing basic, fundamental concepts to their absolute limits. Dedicated to engineering noise-free indicators that reveal true market mechanics and logical edges. Clarity over
Aviso legal
As informações e publicações não se destinam a ser, e não constituem, conselhos ou recomendações financeiras, de investimento, comerciais ou de outro tipo fornecidos ou endossados pela TradingView. Leia mais nos Termos de Uso.