OPEN-SOURCE SCRIPT
Vishal Trades Box Strategy
Vishal Trades Box Strategy
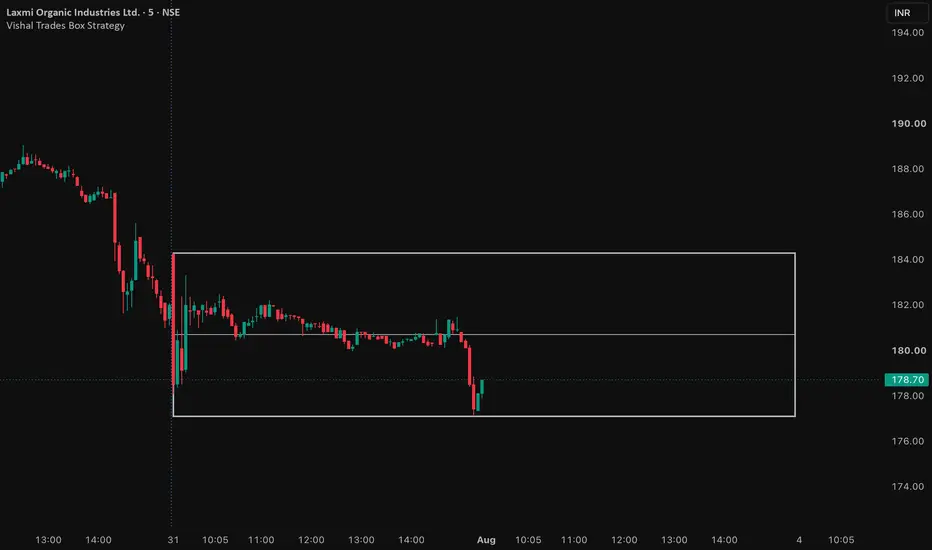
The Vishal Trades Box Strategy is a price action–based trading tool that automatically plots the previous trading session's High, Low, and Midpoint as a range box. The box is extended into the current trading session, allowing traders to identify key support, resistance, breakout, and rejection zones before the market opens.
By using the previous day's range, traders can quickly determine whether price is accepting or rejecting important levels, making it easier to plan high-probability entries, stop-loss placements, and profit targets. The strategy is designed to reduce chart clutter while keeping the most relevant market structure visible throughout the trading day.
Features:
Automatically plots the previous trading session's High and Low.
Draws the 50% midpoint of the previous day's range.
Extends the range into the current trading session.
Clean, lightweight, and non-repainting.
Works seamlessly on intraday timeframes.
Ideal for breakout, reversal, and range-bound trading strategies.
Suitable for stocks, indices, futures, and other liquid markets.
This indicator is built around the philosophy of keeping trading simple by focusing on important price levels rather than unnecessary indicators, helping traders make objective and disciplined trading decisions.
The Vishal Trades Box Strategy is a price action–based trading tool that automatically plots the previous trading session's High, Low, and Midpoint as a range box. The box is extended into the current trading session, allowing traders to identify key support, resistance, breakout, and rejection zones before the market opens.
By using the previous day's range, traders can quickly determine whether price is accepting or rejecting important levels, making it easier to plan high-probability entries, stop-loss placements, and profit targets. The strategy is designed to reduce chart clutter while keeping the most relevant market structure visible throughout the trading day.
Features:
Automatically plots the previous trading session's High and Low.
Draws the 50% midpoint of the previous day's range.
Extends the range into the current trading session.
Clean, lightweight, and non-repainting.
Works seamlessly on intraday timeframes.
Ideal for breakout, reversal, and range-bound trading strategies.
Suitable for stocks, indices, futures, and other liquid markets.
This indicator is built around the philosophy of keeping trading simple by focusing on important price levels rather than unnecessary indicators, helping traders make objective and disciplined trading decisions.
Script de código aberto
Em verdadeiro espírito do TradingView, o criador deste script o tornou de código aberto, para que os traders possam revisar e verificar sua funcionalidade. Parabéns ao autor! Embora você possa usá-lo gratuitamente, lembre-se de que a republicação do código está sujeita às nossas Regras da Casa.

We Teach, You Trade.
youtube.com/@vishaltrades
youtube.com/@vishaltrades
Aviso legal
As informações e publicações não se destinam a ser, e não constituem, conselhos ou recomendações financeiras, de investimento, comerciais ou de outro tipo fornecidos ou endossados pela TradingView. Leia mais nos Termos de Uso.
Script de código aberto
Em verdadeiro espírito do TradingView, o criador deste script o tornou de código aberto, para que os traders possam revisar e verificar sua funcionalidade. Parabéns ao autor! Embora você possa usá-lo gratuitamente, lembre-se de que a republicação do código está sujeita às nossas Regras da Casa.
We Teach, You Trade.
youtube.com/@vishaltrades
youtube.com/@vishaltrades
Aviso legal
As informações e publicações não se destinam a ser, e não constituem, conselhos ou recomendações financeiras, de investimento, comerciais ou de outro tipo fornecidos ou endossados pela TradingView. Leia mais nos Termos de Uso.