HTF Candles - Side Panel
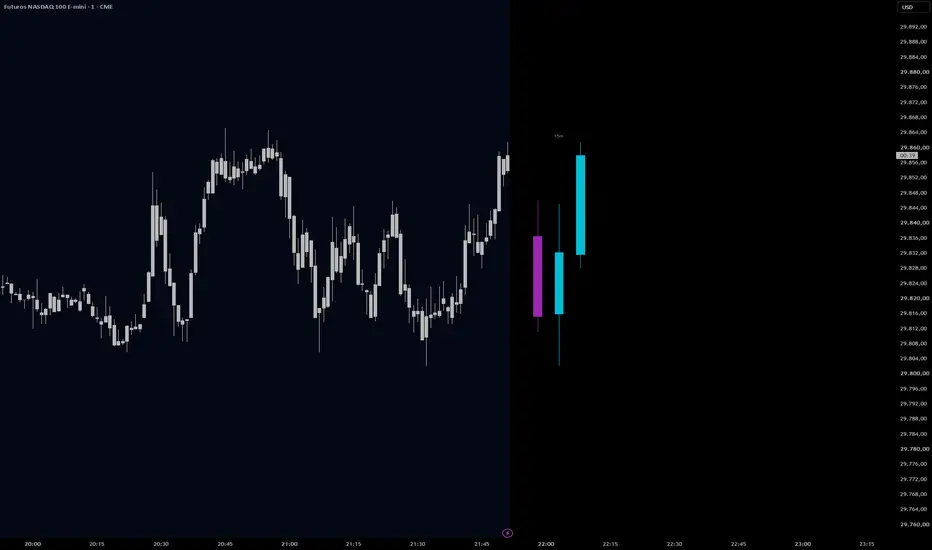
HTF Candles shows the last candles of a higher timeframe as a compact panel to the right of current price. You can follow the higher-timeframe structure without switching charts and without covering the price action with overlaid boxes.
HOW IT WORKS
• Requests the open, high, low and close of the last N bars of the chosen timeframe. The right-most candle is the one still forming and updates in real time.
• Candles are drawn to the right of the last bar, with editable width, spacing and distance, and a small label with the timeframe (e.g. 5m, 15m, 1H).
• Bullish and bearish colors are editable.
• If the selected timeframe is not higher than the chart timeframe, the script shows a message instead of drawing.
HOW TO USE
Keep a lower timeframe for execution and read the higher-timeframe candle in formation next to it. For example, an M5 panel on an M1 chart, or an H1 panel on an M5 chart. Useful things to watch:
• whether the forming candle is sweeping the previous candle's high or low;
• body versus wick: is the candle closing strong or rejecting;
• where the current candle sits relative to the previous ones.
It works well alongside Sigma Map, which draws volatility-based levels from the session open.
LIMITATIONS
• Display only: no signals or alerts.
• The forming candle keeps changing until it closes.
• The panel is drawn on the last bars of the chart, so it is meant for live reading, not for reviewing history.
HOW IT WORKS
• Requests the open, high, low and close of the last N bars of the chosen timeframe. The right-most candle is the one still forming and updates in real time.
• Candles are drawn to the right of the last bar, with editable width, spacing and distance, and a small label with the timeframe (e.g. 5m, 15m, 1H).
• Bullish and bearish colors are editable.
• If the selected timeframe is not higher than the chart timeframe, the script shows a message instead of drawing.
HOW TO USE
Keep a lower timeframe for execution and read the higher-timeframe candle in formation next to it. For example, an M5 panel on an M1 chart, or an H1 panel on an M5 chart. Useful things to watch:
• whether the forming candle is sweeping the previous candle's high or low;
• body versus wick: is the candle closing strong or rejecting;
• where the current candle sits relative to the previous ones.
It works well alongside Sigma Map, which draws volatility-based levels from the session open.
LIMITATIONS
• Display only: no signals or alerts.
• The forming candle keeps changing until it closes.
• The panel is drawn on the last bars of the chart, so it is meant for live reading, not for reviewing history.

Aviso legal
As informações e publicações não se destinam a ser, e não constituem, conselhos ou recomendações financeiras, de investimento, comerciais ou de outro tipo fornecidos ou endossados pela TradingView. Leia mais nos Termos de Uso.
Aviso legal
As informações e publicações não se destinam a ser, e não constituem, conselhos ou recomendações financeiras, de investimento, comerciais ou de outro tipo fornecidos ou endossados pela TradingView. Leia mais nos Termos de Uso.