Uptrick: Volatility Adjusted Mean
Introduction
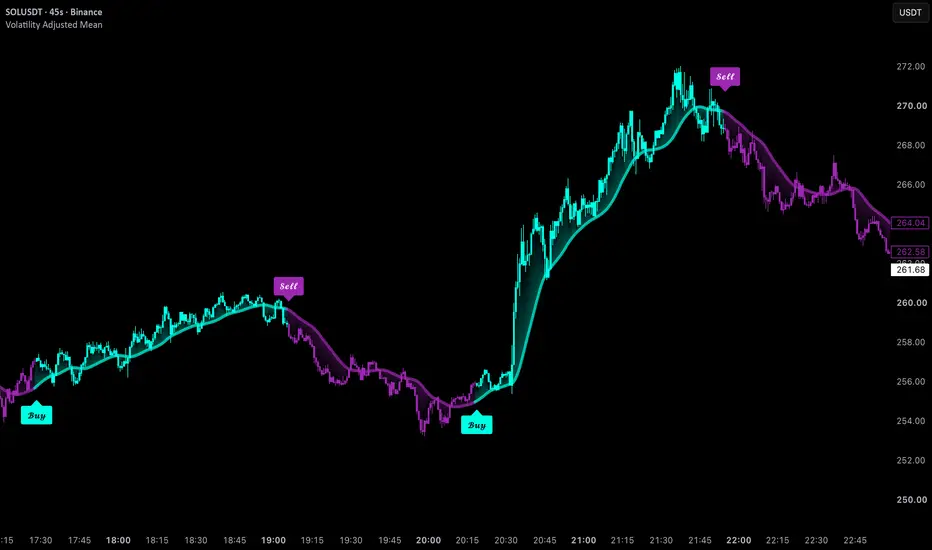
Uptrick: Volatility Adjusted Mean is an overlay trend indicator built around an adaptive center line that changes its speed based on how efficiently price is moving. When price travels cleanly in one direction, the center line speeds up and follows it closely. When price chops back and forth, the line slows down and stays calm. A direction change is only accepted when price closes a volatility-scaled distance beyond the center line, the line itself slopes the same way, and a set of optional noise filters agree for several consecutive closed candles. Each confirmed reversal prints a Buy or Sell label and starts tracking three ATR-based take-profit levels, which are marked on the chart when reached. A gradient fill, trend-colored candles and a compact dashboard show the current state at a glance.
Originality
Many trend tools use a fixed-length moving average and flip direction as soon as price crosses it. That approach reacts the same way in a clean trend and in a sideways range, so it tends to lag in trends and flip repeatedly in ranges. This script combines several components to address that, each chosen for a specific job:
Together these components work as one pipeline: the adaptive line defines where the trend is, the ATR buffer and slope define when price has meaningfully left it, and the filters plus the confirmation counter decide whether that departure is strong and persistent enough to count as a reversal. The take-profit levels then reuse the same ATR measurement, so targets scale with the same volatility that defined the signal.
Features
Inputs
01 · Appearance
02 · Vector Engine
03 · Signals
04 · Noise Filters
05 · Take Profits
06 · Display
How It Works
How to Use
Conclusion
Uptrick: Volatility Adjusted Mean combines an efficiency-adaptive center line with ATR-scaled breakout levels, slope confirmation and optional trend strength, momentum and higher timeframe filters. The goal is to separate meaningful direction changes from ordinary noise around the mean, then measure follow-through with volatility-based take-profit levels. Every component can be tuned or disabled, so the indicator can be adapted to different markets, timeframes and trading styles.
Uptrick: Volatility Adjusted Mean is an overlay trend indicator built around an adaptive center line that changes its speed based on how efficiently price is moving. When price travels cleanly in one direction, the center line speeds up and follows it closely. When price chops back and forth, the line slows down and stays calm. A direction change is only accepted when price closes a volatility-scaled distance beyond the center line, the line itself slopes the same way, and a set of optional noise filters agree for several consecutive closed candles. Each confirmed reversal prints a Buy or Sell label and starts tracking three ATR-based take-profit levels, which are marked on the chart when reached. A gradient fill, trend-colored candles and a compact dashboard show the current state at a glance.
Originality
Many trend tools use a fixed-length moving average and flip direction as soon as price crosses it. That approach reacts the same way in a clean trend and in a sideways range, so it tends to lag in trends and flip repeatedly in ranges. This script combines several components to address that, each chosen for a specific job:
- The center line uses efficiency ratio smoothing, similar in concept to Kaufman's Adaptive Moving Average. It measures how much of the recent price movement was directional versus noise and adjusts its smoothing speed between a fast and a slow limit. This lets the same line be responsive during directional moves and stable during choppy conditions, without the user having to switch settings. A final EMA pass removes the remaining small wiggles so the line is easy to read.
- The crossing threshold is scaled by ATR instead of being a fixed price distance or a plain cross. Price must close a set number of ATRs beyond the center line, so the threshold widens automatically in volatile markets and tightens in quiet ones, and it behaves consistently across different symbols and timeframes.
- A slope requirement makes sure the center line agrees with the breakout. A close beyond the band while the line still points the other way is not treated as a reversal.
- The minimum slope filter measures the line's movement relative to ATR, so a barely tilted line in a flat market does not qualify.
- ADX with DI direction agreement is used to reject breakouts that happen during weak or directionless conditions, which is where adaptive lines are most likely to produce false flips.
- RSI confirms that momentum supports the direction of the breakout, using separate bullish and bearish thresholds placed slightly away from 50.
- The optional higher timeframe EMA filter adds broader trend context using only the last completed higher timeframe candle.
- The consecutive confirmation counter requires all conditions to hold on several closed candles in a row, so a single candle poking through the band is not enough.
- The cooldown keeps signals spaced apart after a reversal.
Together these components work as one pipeline: the adaptive line defines where the trend is, the ATR buffer and slope define when price has meaningfully left it, and the filters plus the confirmation counter decide whether that departure is strong and persistent enough to count as a reversal. The take-profit levels then reuse the same ATR measurement, so targets scale with the same volatility that defined the signal.
Features
- Adaptive center line calculated from hlc3 using efficiency ratio based smoothing
- Smoothing speed that moves between a configurable fast and slow limit depending on market efficiency
- Final EMA smoothing pass on the center line for a cleaner, calmer curve
- Center line colored by the active trend direction
- ATR-scaled switch buffer above and below the center line that price must close beyond to flip direction
- Center line slope direction check over a configurable lookback
- Minimum slope strength filter measured in ATR units
- ADX trend strength filter that also requires +DI and -DI to agree with the signal direction
- RSI momentum confirmation with separate Buy and Sell thresholds
- Optional higher timeframe alignment filter using a higher timeframe EMA
- Higher timeframe data taken from the last completed higher timeframe candle to avoid repainting
- Higher timeframe validity check that only accepts a timeframe higher than the chart timeframe
- Each filter can be switched on or off independently
- Consecutive confirmation counter that requires conditions to hold on multiple closed candles in a row
- Configurable cooldown between signals
- Signals only appear on actual direction changes, so the same direction is never signaled twice in a row
- All signal logic evaluated on confirmed (closed) bars only
- Buy and Sell labels anchored to the center line with an ATR offset instead of to candle highs and lows
- Hover tooltips on every Buy and Sell label
- Three take-profit levels calculated from the signal candle's close using ATR multiples
- TP X markers placed on the candle where each level is first reached
- Each take-profit level marked only once per signal
- ATR-based offset for TP markers so they sit clear of the candles
- Take-profit levels reset automatically on every new signal
- Vertical gradient fill between the center line and price that fades from the line toward price
- Trend-colored candles painted with the bullish or bearish color
- Read-only dashboard in the top right corner showing Direction, Center Line value, Line Slope, ADX Strength, RSI Momentum and Take Profit status
- Take Profit status in the dashboard showing No Trade, Active, TP1 Hit, TP2 Hit or TP3 Hit
- Dashboard is display-only and has no effect on signals
- Five alert conditions: Buy, Sell, TP1 reached, TP2 reached and TP3 reached
- Fully customizable colors for bullish and bearish states, label text and TP markers
- Show or hide toggles for signals, TP markers, gradient, trend candles and center line
- Adjustable transparency for the gradient and the center line
Inputs
01 · Appearance
- Bullish Color: color used for bullish candles, the center line, gradient and Buy labels (default #00FFE5)
- Bearish Color: color used for bearish candles, the center line, gradient and Sell labels (default #7030A0)
- Buy Text: text color inside Buy labels (default black)
- Sell Text: text color inside Sell labels (default white)
- TP X Color: color of the take-profit X markers (default white)
02 · Vector Engine
- Center Responsiveness: efficiency ratio lookback for the adaptive center line. Lower is faster, higher is smoother (default 18)
- Fast Response: fastest smoothing speed the center line can use during directional movement (default 4)
- Slow Response: slowest smoothing speed the center line can use during sideways movement (default 30)
- Center Smoothing: length of the final EMA applied to the center line (default 5)
- ATR Length: ATR period used for the switch buffer, slope filter, label placement and TP levels (default 14)
- Switch Buffer: how many ATRs beyond the center line price must close to qualify for a flip. Higher means fewer switches (default 0.50)
- Slope Lookback: number of bars used to check whether the center line is rising or falling (default 3)
03 · Signals
- Show Buy / Sell: shows or hides the Buy and Sell labels (default on)
- Signal Center Offset: Buy labels are placed this many ATRs below the center line and Sell labels the same distance above it (default 0.7)
04 · Noise Filters
- Trend Strength (ADX): enables the ADX and DI direction filter (default on)
- ADX Period: lookback for directional movement and ADX smoothing (default 14)
- Minimum ADX: minimum ADX value required for a signal (default 20)
- Momentum Confirmation (RSI): enables the RSI filter (default on)
- RSI Period: RSI length (default 14)
- Buy RSI Above: RSI must be above this value for a Buy (default 52)
- Sell RSI Below: RSI must be below this value for a Sell (default 48)
- Minimum Center Slope: enables the ATR-relative slope strength filter (default on)
- Minimum Slope (ATR): the center line's movement over the slope lookback must exceed this fraction of one ATR (default 0.12)
- Consecutive Confirmations: number of closed candles in a row that must meet all conditions before a signal (default 2)
- Bars Between Signals: minimum number of bars between signals. 0 disables the cooldown (default 6)
- Higher Timeframe Alignment: enables the higher timeframe EMA filter (default off)
- Higher Timeframe: timeframe used by the filter. It must be higher than the chart timeframe, otherwise no signals pass the filter while it is enabled (default 4H)
- Higher Timeframe EMA: EMA length on the higher timeframe. Buys need the last completed higher timeframe close above it, Sells below it (default 50)
05 · Take Profits
- Show TP Xs: shows or hides the take-profit markers (default on)
- TP1 Distance: distance from the signal close in ATR units (default 1.0)
- TP2 Distance: distance from the signal close in ATR units (default 2.0)
- TP3 Distance: distance from the signal close in ATR units (default 3.25)
- TP X Offset: how many ATRs above the candle high (long) or below the candle low (short) the X marker is placed (default 0.6)
06 · Display
- Vertical Gradient: shows or hides the gradient between the center line and price (default on)
- Trend Candles: paints candles with the active trend color (default on)
- Smooth Center Line: shows or hides the center line. Signal label placement still uses it when hidden (default on)
- Gradient At Center: transparency of the gradient where it touches the center line (default 72)
- Center Transparency: transparency of the center line (default 20)
How It Works
- Efficiency ratio: over the Center Responsiveness lookback, the script divides the net change in hlc3 by the sum of all bar-to-bar changes over the same period. The result ranges from 0 to 1. A value near 1 means price moved in a straight line, a value near 0 means most of the movement cancelled itself out.
- Adaptive smoothing: the efficiency ratio is used to blend between a fast smoothing constant (from Fast Response) and a slow one (from Slow Response). The blended value is squared, which pushes the line further toward slow behavior in noisy conditions. The adaptive line then moves toward price by that amount each bar, and a final EMA (Center Smoothing) produces the center line shown on the chart.
- Switch band: ATR multiplied by Switch Buffer is added above and subtracted below the center line. A bullish breakout requires a close above the upper level, a bearish breakout a close below the lower level.
- Slope check: the center line is compared with its own value Slope Lookback bars ago. A bullish breakout needs a rising line, a bearish breakout a falling line.
- Filters: when enabled, the ADX filter requires ADX at or above Minimum ADX with +DI above -DI for Buys and -DI above +DI for Sells. The RSI filter requires RSI above Buy RSI Above for Buys and below Sell RSI Below for Sells. The slope strength filter requires the center line to have moved at least Minimum Slope (ATR) times ATR over the slope lookback. The higher timeframe filter compares the last completed higher timeframe close with its EMA.
- Confirmation: on every closed candle where the breakout, slope and all enabled filters agree, a streak counter increases. Any closed candle that fails resets it to zero. A signal is only allowed once the streak reaches Consecutive Confirmations.
- Signal: a Buy is printed only when the current trend is bearish, the bullish streak is complete and the cooldown has passed. A Sell works the same way in reverse. The trend then flips, and the center line, gradient and candles change color.
- Take profits: at each signal, TP1, TP2 and TP3 are calculated from the signal candle's close using the ATR multiples. Starting from the next bar, each closed candle is checked against the levels using its high for long signals and its low for short signals. The first time a level is reached, an X marker is plotted and that level is marked as hit, so it is not plotted again for the same signal. A new signal resets all three levels.
- Display: the gradient is drawn between the center line and the close, strongest at the center line and fading toward price. The dashboard updates on the last bar and shows the current direction, center line value, slope state, ADX value with a Strong or Weak reading relative to Minimum ADX, RSI value and take-profit status.
How to Use
- Use the center line color and trend candles to read the active direction. Bullish color means the last confirmed reversal was upward, bearish color means it was downward.
- Treat Buy and Sell labels as confirmed direction changes, not as standalone entries. They mark the point where price, slope and the enabled filters agreed for the required number of closed candles.
- Use the distance between price and the center line, shown by the gradient, to judge how extended price is from its adaptive mean.
- Use the TP X markers and the dashboard's Take Profit status to see how far price has traveled in ATR terms since the last signal.
- For fewer and more selective signals, raise Switch Buffer, Consecutive Confirmations, Minimum ADX or Bars Between Signals, or enable Higher Timeframe Alignment.
- For faster reactions, lower Center Responsiveness, Switch Buffer or Consecutive Confirmations, or disable individual filters.
- When using Higher Timeframe Alignment, choose a timeframe above your chart timeframe, for example 4H on a 1H chart.
- Set alerts on Buy, Sell or any TP level using the five built-in alert conditions.
- Combine the indicator with your own risk management and analysis. The take-profit levels are reference points based on volatility, not recommendations.
Conclusion
Uptrick: Volatility Adjusted Mean combines an efficiency-adaptive center line with ATR-scaled breakout levels, slope confirmation and optional trend strength, momentum and higher timeframe filters. The goal is to separate meaningful direction changes from ordinary noise around the mean, then measure follow-through with volatility-based take-profit levels. Every component can be tuned or disabled, so the indicator can be adapted to different markets, timeframes and trading styles.
Disclaimer
This indicator is provided for educational and informational purposes only and does not constitute financial advice. Trading involves substantial risk, and past behavior of any indicator or market does not guarantee future results. Signals and take-profit levels are based on historical price data and can be wrong. Always do your own research and use proper risk management before making any trading decision.

💎 Free Discord: discord.gg/Def47ueyuD
💎 Website: uptrick.io
Nothing is financial advice. Always do your own research.
💎 Website: uptrick.io
Nothing is financial advice. Always do your own research.
Aviso legal
As informações e publicações não se destinam a ser, e não constituem, conselhos ou recomendações financeiras, de investimento, comerciais ou de outro tipo fornecidos ou endossados pela TradingView. Leia mais nos Termos de Uso.
💎 Free Discord: discord.gg/Def47ueyuD
💎 Website: uptrick.io
Nothing is financial advice. Always do your own research.
💎 Website: uptrick.io
Nothing is financial advice. Always do your own research.
Aviso legal
As informações e publicações não se destinam a ser, e não constituem, conselhos ou recomendações financeiras, de investimento, comerciais ou de outro tipo fornecidos ou endossados pela TradingView. Leia mais nos Termos de Uso.