Swing Volume Arcs [AlgoNorth]
Swing Volume Arcs
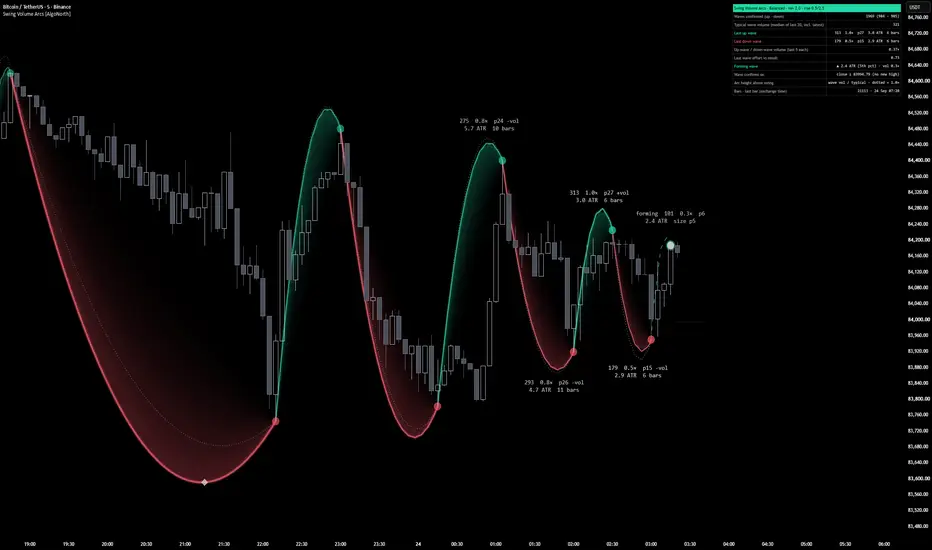
Every swing on your chart carries a volume story. This script draws it, one arc per swing, right on the price. The heavier the volume behind a move, the taller and thicker its arc. The swing in progress is traced live and sets solid the moment it completes, so the chart reads as a run of arcs that tell you, before you read a label, which legs the market leaned into and which it barely touched.
Volume usually lives in a pane at the bottom, one bar at a time. Here it lives on the price itself, one swing at a time. A dotted 1× arc sits beside each one, so heavier or lighter than typical is obvious at a glance. Glowing sails, percentiles, an effort vs result ◆ and a live stats table finish it off.
🔶 USAGE
🔸 Watch the forming arc. Drawn dashed, it runs from the last swing point to the current extreme, with a live dot at the extreme, a "forming" label carrying the running volume and size, and a dotted line at the price that would complete the swing. The table's "Wave confirms on" row prints that price.
🔸 When the swing completes, the arc turns solid. Green arcs bow above up swings; red arcs bow below down swings. In Volume mode the arc rises above its swing point in proportion to volume ÷ typical volume: a 2.0× swing rises exactly twice as far as a 1.0× swing, up to the cap.
🔸 Compare each arc with its dotted 1× reference arc, drawn where a typical-volume swing of that size would sit. Solid arc outside the dots = heavier than typical; inside = lighter.
🔸 Read the detail labels on the latest swings: volume, × typical, percentile, +vol / -vol against the previous swing in the same direction, size in ATR and bar count.
🔸 A ◆ marks a swing that took heavy volume for a small move: (volume ÷ typical volume) ÷ (size ÷ typical size) at or above the Effort vs result flag. The table's row 6 spells it out.
🔸 Sails fill the space between each arc and the straight line joining its swing points, fading in the direction you choose.
🔸 The live table (any corner) shows swings counted, typical swing volume, the last up and down swing, the up/down volume ratio over the last 5 of each, the last effort vs result value, the forming swing, the completion price, how arc height is being measured, and the bar count with the last-bar timestamp.
🔸 Alerts: up swing completed, down swing completed, effort vs result swing.
🔶 DETAILS
🔸 Swing definition. A swing runs from one extreme to the next. It ends when a bar closes the Reversal distance (in ATR) back from the extreme without making a new extreme. The extreme is then the swing point, the opposite extreme found back to that point starts the next swing, and the volume of every bar between the two extremes is the swing's volume.
🔸 Volume source. Swing volume is the sum of each bar's exchange volume. The script has no bid/ask or trade-side data; it does not know who was the aggressor, only how much traded.
🔸 Typical swing. The median volume of the previous N swings (default 20). Each swing's multiple is measured against the swings before it, so a swing is never compared with itself.
🔸 Percentiles. Volume and size percentiles are measured against the previous swings in the lookback (default 100) and fixed when the swing completes.
🔸 Arc geometry. The arc is a curve from swing point to swing point whose peak sits exactly the chosen height above the swing. In Volume mode that height is Rise per 1× volume × (volume ÷ typical), clamped between 0.2× and the cap. In Wave-height mode, and on symbols without volume data, it is a fraction of the price move with a minimum in ATR.
🔸 Thickness. Line width also scales with the volume multiple in every style, so heavy swings are both taller and thicker.
🔸 Age fade. Older arcs are drawn slightly dimmer as newer swings arrive. Only their opacity changes.
🔸 Statistics are kept over the most recent 400 swings; the drawn set is the latest N (default 12).
🔶 SETTINGS
🔸 Waves: Reversal (× ATR), ATR length, Typical wave = median of (waves), Percentile lookback, Effort vs result flag.
🔸 Arcs: Style (Balanced / Quant / Glow), Arc height from (Volume / Wave height), Rise per 1× volume, Rise cap, 1× reference arc, Rise (× wave height), Minimum rise, Brightness, Arcs shown, Sail bands, Maximum arc width (Glow), Up and Down colours, Glow, Sails, Sail fade, Sail strength, Swing dots, Wave volume at swings, Detail labels, Label text size, Effort vs result diamonds, Forming wave.
🔸 Table: Show table, Table corner. Hover the table header for a full dump of the live settings.
🔸 Styles: Balanced (medium lines, soft glow), Quant (thin lines, light sails, no glow), Glow (bright arcs for screenshots, wider font). Balanced and Quant print percentiles on chart labels; Glow does not.
🔶 NOTES
🔸 Each arc is set solid once a bar closes the Reversal distance back from the swing's extreme, so the completed arc lands a few bars after the turn. Until then you have the forming arc to watch.
🔸 The forming arc is the only thing that moves. Once an arc is drawn its position and numbers never change; older arcs only dim as newer swings arrive. Applies to standard candle and bar charts.
🔸 Volume is the exchange volume traded within each swing, so it shows how much traded rather than the bid/ask split. Symbols without volume data still get their arcs, sized from swing height, with a note in the table header.
🔸 Typical volume and percentiles are learned from the swings on your chart, so the more history you load, the steadier the reference.
🔸 Renko, Kagi and Point & Figure charts can rebuild past bars, which can move stored swing points. The table header flags these chart types for you.
🔶 SUMMARY
Volume, drawn where it happened. Each swing leaves an arc that shows how much the market put behind it, the swing in progress is traced live, and the arcs tell the story before you read a label.
Every swing on your chart carries a volume story. This script draws it, one arc per swing, right on the price. The heavier the volume behind a move, the taller and thicker its arc. The swing in progress is traced live and sets solid the moment it completes, so the chart reads as a run of arcs that tell you, before you read a label, which legs the market leaned into and which it barely touched.
Volume usually lives in a pane at the bottom, one bar at a time. Here it lives on the price itself, one swing at a time. A dotted 1× arc sits beside each one, so heavier or lighter than typical is obvious at a glance. Glowing sails, percentiles, an effort vs result ◆ and a live stats table finish it off.
🔶 USAGE
🔸 Watch the forming arc. Drawn dashed, it runs from the last swing point to the current extreme, with a live dot at the extreme, a "forming" label carrying the running volume and size, and a dotted line at the price that would complete the swing. The table's "Wave confirms on" row prints that price.
🔸 When the swing completes, the arc turns solid. Green arcs bow above up swings; red arcs bow below down swings. In Volume mode the arc rises above its swing point in proportion to volume ÷ typical volume: a 2.0× swing rises exactly twice as far as a 1.0× swing, up to the cap.
🔸 Compare each arc with its dotted 1× reference arc, drawn where a typical-volume swing of that size would sit. Solid arc outside the dots = heavier than typical; inside = lighter.
🔸 Read the detail labels on the latest swings: volume, × typical, percentile, +vol / -vol against the previous swing in the same direction, size in ATR and bar count.
🔸 A ◆ marks a swing that took heavy volume for a small move: (volume ÷ typical volume) ÷ (size ÷ typical size) at or above the Effort vs result flag. The table's row 6 spells it out.
🔸 Sails fill the space between each arc and the straight line joining its swing points, fading in the direction you choose.
🔸 The live table (any corner) shows swings counted, typical swing volume, the last up and down swing, the up/down volume ratio over the last 5 of each, the last effort vs result value, the forming swing, the completion price, how arc height is being measured, and the bar count with the last-bar timestamp.
🔸 Alerts: up swing completed, down swing completed, effort vs result swing.
🔶 DETAILS
🔸 Swing definition. A swing runs from one extreme to the next. It ends when a bar closes the Reversal distance (in ATR) back from the extreme without making a new extreme. The extreme is then the swing point, the opposite extreme found back to that point starts the next swing, and the volume of every bar between the two extremes is the swing's volume.
🔸 Volume source. Swing volume is the sum of each bar's exchange volume. The script has no bid/ask or trade-side data; it does not know who was the aggressor, only how much traded.
🔸 Typical swing. The median volume of the previous N swings (default 20). Each swing's multiple is measured against the swings before it, so a swing is never compared with itself.
🔸 Percentiles. Volume and size percentiles are measured against the previous swings in the lookback (default 100) and fixed when the swing completes.
🔸 Arc geometry. The arc is a curve from swing point to swing point whose peak sits exactly the chosen height above the swing. In Volume mode that height is Rise per 1× volume × (volume ÷ typical), clamped between 0.2× and the cap. In Wave-height mode, and on symbols without volume data, it is a fraction of the price move with a minimum in ATR.
🔸 Thickness. Line width also scales with the volume multiple in every style, so heavy swings are both taller and thicker.
🔸 Age fade. Older arcs are drawn slightly dimmer as newer swings arrive. Only their opacity changes.
🔸 Statistics are kept over the most recent 400 swings; the drawn set is the latest N (default 12).
🔶 SETTINGS
🔸 Waves: Reversal (× ATR), ATR length, Typical wave = median of (waves), Percentile lookback, Effort vs result flag.
🔸 Arcs: Style (Balanced / Quant / Glow), Arc height from (Volume / Wave height), Rise per 1× volume, Rise cap, 1× reference arc, Rise (× wave height), Minimum rise, Brightness, Arcs shown, Sail bands, Maximum arc width (Glow), Up and Down colours, Glow, Sails, Sail fade, Sail strength, Swing dots, Wave volume at swings, Detail labels, Label text size, Effort vs result diamonds, Forming wave.
🔸 Table: Show table, Table corner. Hover the table header for a full dump of the live settings.
🔸 Styles: Balanced (medium lines, soft glow), Quant (thin lines, light sails, no glow), Glow (bright arcs for screenshots, wider font). Balanced and Quant print percentiles on chart labels; Glow does not.
🔶 NOTES
🔸 Each arc is set solid once a bar closes the Reversal distance back from the swing's extreme, so the completed arc lands a few bars after the turn. Until then you have the forming arc to watch.
🔸 The forming arc is the only thing that moves. Once an arc is drawn its position and numbers never change; older arcs only dim as newer swings arrive. Applies to standard candle and bar charts.
🔸 Volume is the exchange volume traded within each swing, so it shows how much traded rather than the bid/ask split. Symbols without volume data still get their arcs, sized from swing height, with a note in the table header.
🔸 Typical volume and percentiles are learned from the swings on your chart, so the more history you load, the steadier the reference.
🔸 Renko, Kagi and Point & Figure charts can rebuild past bars, which can move stored swing points. The table header flags these chart types for you.
🔶 SUMMARY
Volume, drawn where it happened. Each swing leaves an arc that shows how much the market put behind it, the swing in progress is traced live, and the arcs tell the story before you read a label.

Aviso legal
As informações e publicações não se destinam a ser, e não constituem, conselhos ou recomendações financeiras, de investimento, comerciais ou de outro tipo fornecidos ou endossados pela TradingView. Leia mais nos Termos de Uso.
Aviso legal
As informações e publicações não se destinam a ser, e não constituem, conselhos ou recomendações financeiras, de investimento, comerciais ou de outro tipo fornecidos ou endossados pela TradingView. Leia mais nos Termos de Uso.