OPEN-SOURCE SCRIPT
Atualizado Quantum Velocity Candles v2
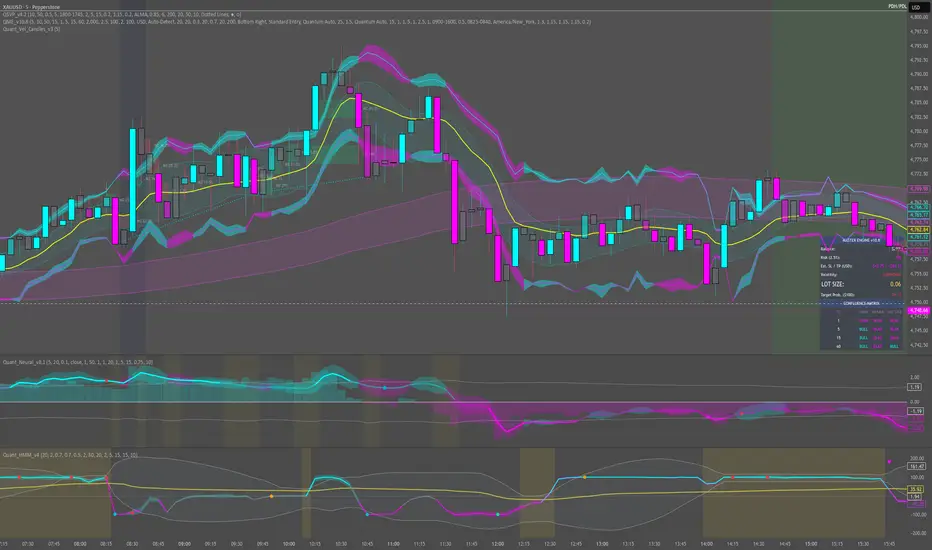
Quantum Velocity Candles - Kinetic Energy Visualizer
Overview
Standard candlestick charts treat every price movement equally. A 10-pip candle moving sluggishly over 5 minutes looks identical to a 10-pip candle that exploded in 3 seconds. The Quantum Velocity Candles indicator solves this by visualizing the actual physics of the market. It calculates underlying Velocity and Acceleration, painting your candles with dynamic gradients. Explosive institutional momentum glows bright neon, while choppy, dying momentum fades into transparent "ghost" candles.
Key Highlights
How to Trade It
Use this to manage your psychology and trade management. When you enter a breakout, you want to see bright, solid candles. If you are in a trend and the candles begin to fade and become transparent, it physically shows you that the momentum is dying—telling you to move your stop loss to breakeven or take profits before the reversal hits.
⚠️ DISCLAIMER: STRICTLY FOR EDUCATIONAL PURPOSES
The information, scripts, and concepts provided in this publication are for educational and informational purposes only and do not constitute financial, investment, or trading advice. Trading in financial markets (including Forex, Crypto, Stocks, and Commodities) carries a high level of risk and may not be suitable for all investors. You could lose some or all of your initial investment. Past performance is not indicative of future results. Always conduct your own due diligence, backtest any strategy thoroughly, and consult with a certified financial advisor before making any trading decisions. By using this script, you acknowledge that you are solely responsible for your own trading actions and outcomes.
Overview
Standard candlestick charts treat every price movement equally. A 10-pip candle moving sluggishly over 5 minutes looks identical to a 10-pip candle that exploded in 3 seconds. The Quantum Velocity Candles indicator solves this by visualizing the actual physics of the market. It calculates underlying Velocity and Acceleration, painting your candles with dynamic gradients. Explosive institutional momentum glows bright neon, while choppy, dying momentum fades into transparent "ghost" candles.
Key Highlights
- Kinetic Physics Engine: Measures the rate of change (Velocity) and the rate of change of the velocity (Acceleration) to gauge true market intent.
- Natural Direction Alignment: Respects natural price action. Bullish candles (Close > Open) are colored Cyan, and Bearish candles (Close < Open) are colored Magenta.
- Adaptive Brightness: The intensity of the color dynamically scales to the current asset's volatility. A candle only glows at 100% opacity when true, statistical acceleration is occurring.
- Zero Clutter: Applies directly to your main chart via barcolor, requiring no extra sub-charts.
How to Trade It
Use this to manage your psychology and trade management. When you enter a breakout, you want to see bright, solid candles. If you are in a trend and the candles begin to fade and become transparent, it physically shows you that the momentum is dying—telling you to move your stop loss to breakeven or take profits before the reversal hits.
⚠️ DISCLAIMER: STRICTLY FOR EDUCATIONAL PURPOSES
The information, scripts, and concepts provided in this publication are for educational and informational purposes only and do not constitute financial, investment, or trading advice. Trading in financial markets (including Forex, Crypto, Stocks, and Commodities) carries a high level of risk and may not be suitable for all investors. You could lose some or all of your initial investment. Past performance is not indicative of future results. Always conduct your own due diligence, backtest any strategy thoroughly, and consult with a certified financial advisor before making any trading decisions. By using this script, you acknowledge that you are solely responsible for your own trading actions and outcomes.
Notas de Lançamento
🚨 OFFICIAL RELEASE NOTES: QUANTUM INTELLIGENCE SUITE 🚨Deployment Date: April 12, 2026
Target: Standalone Visual Indicators
To ensure complete algorithmic uniformity across the Quantum Intelligence Suite, the legacy continuous-gradient engines in our standalone candle scripts have been fully replaced with the v2 Kinetic Physics Engine.
🟢 1. Quantum Velocity Candles upgraded to v3
Kinetic Synchronization: The indicator now utilizes the 3rd-derivative (Jerk) mathematics to explicitly identify the "Squeeze," "Build," and "Snap" phases of momentum.
Color Matrix Overhaul: The adaptive opacity gradient has been replaced by the Hyper-Glow matrix, matching the exact color thresholds of the CVD Confluence indicator to ensure zero visual contradiction across your trading view.
🟢 2. Quantum Kinetic Candles [Velocity + Equivolume] upgraded to v2
4D Integration: The custom Equivolume drawing engine (which dynamically thickens candles based on relative volume) now seamlessly integrates the new Hyper-Glow colors.
Unified Visuals: Wicks and bodies now instantly react to the exact millisecond Velocity, Acceleration, and Jerk perfectly align, allowing traders to see both the volume size and the kinetic speed of an institutional move simultaneously.
Script de código aberto
Em verdadeiro espírito do TradingView, o criador deste script o tornou de código aberto, para que os traders possam revisar e verificar sua funcionalidade. Parabéns ao autor! Embora você possa usá-lo gratuitamente, lembre-se de que a republicação do código está sujeita às nossas Regras da Casa.

Aviso legal
As informações e publicações não se destinam a ser, e não constituem, conselhos ou recomendações financeiras, de investimento, comerciais ou de outro tipo fornecidos ou endossados pela TradingView. Leia mais nos Termos de Uso.
Script de código aberto
Em verdadeiro espírito do TradingView, o criador deste script o tornou de código aberto, para que os traders possam revisar e verificar sua funcionalidade. Parabéns ao autor! Embora você possa usá-lo gratuitamente, lembre-se de que a republicação do código está sujeita às nossas Regras da Casa.
Aviso legal
As informações e publicações não se destinam a ser, e não constituem, conselhos ou recomendações financeiras, de investimento, comerciais ou de outro tipo fornecidos ou endossados pela TradingView. Leia mais nos Termos de Uso.