OPEN-SOURCE SCRIPT
Auto Parallel Channels (HTF)
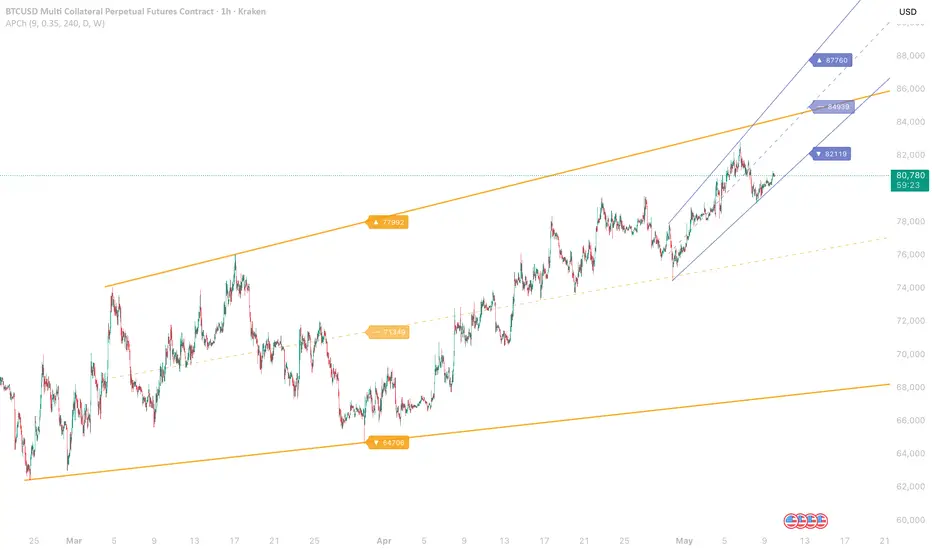
Auto Parallel Channels (HTF)
Auto-detected parallel channels drawn between confirmed pivot highs and pivot lows on up to three higher timeframes. A channel forms only when two pivot highs and two pivot lows produce trendlines that are actually parallel within a configurable slope tolerance — the indicator stays silent when the geometry implies a triangle, wedge, or unstructured noise rather than a true channel.
The point is to surface validated parallel structure on multiple horizons without fabricating channels through every cluster of swings.
How it works
For each of the three configured timeframes, the script runs pivot detection inside request.security and tracks the two most recent pivot highs and the two most recent pivot lows. It then asks a strict question: would these four pivots produce a parallel channel?
The check works by:
If the slopes diverge — converging into a wedge or fanning out — the channel is rejected and nothing is drawn. This is deliberate: a channel that isn't parallel isn't a channel.
A valid channel is marked broken when close on the timeframe's own bars exceeds either boundary. Broken channels stop extending right and dim. All lines and labels rebuild on the last bar to keep projections current.
How to read it
Each timeframe has its own color (defaults: indigo for TF1, amber for TF2, teal for TF3). Line weight increases with timeframe — thin for TF1, medium for TF2, thick for TF3 — so the dominant higher timeframe reads first.
Visual elements per channel:
When channels from different timeframes overlap or share boundaries, that's confluence — a higher-timeframe boundary respected by a lower-timeframe channel is the more meaningful structural reference.
Inputs
Built-in alerts
Notes
The strict parallelism check is this indicator's most opinionated design choice. Most auto-channel tools draw something on any four pivots, even when the geometry is clearly a wedge or triangle. This one refuses — if the slopes don't match within tolerance, no channel appears. Fewer channels, higher quality.
If you've also published Auto Parallel Channel (HTF) (singular): that indicator builds a single pitchfork-style channel from three of the last four zigzag pivots, with no parallelism validation. This one (plural) draws a separate channel per timeframe, validated for actual parallel geometry. They use different definitions of "channel" and will produce different output on the same chart. Pick the one whose definition matches your intent — or use both, treating the singular one as approximate structure and this one as confirmed parallel structure.
The pivot length is shared across all three timeframes by design here. Most parallel structures have similar swing-density requirements regardless of timeframe — a length that finds meaningful pivots on the daily usually finds meaningful pivots on the weekly too, just spaced further apart in calendar time. If one timeframe is over- or under-detecting, adjust the slope tolerance rather than the pivot length.
Higher-timeframe pivots don't confirm until pivot length bars after the actual high or low. On Weekly with length 9, that's nine weeks of delay between the swing and the channel appearing. Geometry is non-repainting once it prints.
When no channel appears on a timeframe, it usually means either (a) fewer than two pivot highs and two pivot lows have accumulated, or (b) the pivots that exist don't form a parallel structure within tolerance. Both are normal states. Lower the pivot length to speed up (a); raise the slope tolerance to relax (b).
This is a structural tool, not a signal generator. It surfaces validated parallel channels on each higher timeframe and flags when price has broken them.
Five years of work on a trading system left me with dozens of indicators that ultimately didn't earn a place in the final build. They're not failures — they're tools that solved problems I no longer needed solved. So instead of shelving them, I'm publishing the majority of them open-source.
If you're a discretionary trader, take what's useful. If you're a systems builder, the source is yours to dissect, modify, and improve. The best return on five years of work is for it to keep working — for someone.
If you use this script — or part of it — in your own work, please credit the original with a link back to my profile.
Note: these indicators have been updated to Pine Script v6 — some manually, some with AI assistance.
Auto-detected parallel channels drawn between confirmed pivot highs and pivot lows on up to three higher timeframes. A channel forms only when two pivot highs and two pivot lows produce trendlines that are actually parallel within a configurable slope tolerance — the indicator stays silent when the geometry implies a triangle, wedge, or unstructured noise rather than a true channel.
The point is to surface validated parallel structure on multiple horizons without fabricating channels through every cluster of swings.
How it works
For each of the three configured timeframes, the script runs pivot detection inside request.security and tracks the two most recent pivot highs and the two most recent pivot lows. It then asks a strict question: would these four pivots produce a parallel channel?
The check works by:
- Computing the slope of the upper line (between the two pivot highs) and the slope of the lower line (between the two pivot lows).
- Projecting the channel width at the second high and at one channel-length forward.
- Accepting the channel only if the width changes by less than slope_tol between those two points.
If the slopes diverge — converging into a wedge or fanning out — the channel is rejected and nothing is drawn. This is deliberate: a channel that isn't parallel isn't a channel.
A valid channel is marked broken when close on the timeframe's own bars exceeds either boundary. Broken channels stop extending right and dim. All lines and labels rebuild on the last bar to keep projections current.
How to read it
Each timeframe has its own color (defaults: indigo for TF1, amber for TF2, teal for TF3). Line weight increases with timeframe — thin for TF1, medium for TF2, thick for TF3 — so the dominant higher timeframe reads first.
Visual elements per channel:
- Upper boundary — solid line through the two pivot highs, extending to the right edge.
- Lower boundary — solid line through the two pivot lows, extending to the right edge.
- Midline — dashed line through the centre of the channel, optional.
- Right-edge labels — projected upper, midline, and lower prices one channel-length forward (▲ upper, ─ midline, ▼ lower).
When channels from different timeframes overlap or share boundaries, that's confluence — a higher-timeframe boundary respected by a lower-timeframe channel is the more meaningful structural reference.
Inputs
- Pivot length — bars required on each side to confirm a pivot. Default 9. Higher values find fewer, more significant pivots. Shared across all three timeframes.
- Slope tolerance — how much the channel width can change over one channel-length before the structure is rejected. Default 0.35 (35% width change accepted, handles slight wedging). Set to 0.0 for perfectly parallel only; raise to 0.5–0.7 if too few channels appear.
- Timeframes 1/2/3 — defaults: 4H, Daily, Weekly. All three on by default.
- Colors — one per timeframe.
- Midline — toggle the dashed centre line. Default on.
- Right-edge labels — toggle the upper/midline/lower price labels at the projected forward edge. Default on.
Built-in alerts
- Channel formed — fires when a new valid channel is detected on any enabled timeframe
- Channel broken — fires when an active channel is broken by close on any enabled timeframe
Notes
The strict parallelism check is this indicator's most opinionated design choice. Most auto-channel tools draw something on any four pivots, even when the geometry is clearly a wedge or triangle. This one refuses — if the slopes don't match within tolerance, no channel appears. Fewer channels, higher quality.
If you've also published Auto Parallel Channel (HTF) (singular): that indicator builds a single pitchfork-style channel from three of the last four zigzag pivots, with no parallelism validation. This one (plural) draws a separate channel per timeframe, validated for actual parallel geometry. They use different definitions of "channel" and will produce different output on the same chart. Pick the one whose definition matches your intent — or use both, treating the singular one as approximate structure and this one as confirmed parallel structure.
The pivot length is shared across all three timeframes by design here. Most parallel structures have similar swing-density requirements regardless of timeframe — a length that finds meaningful pivots on the daily usually finds meaningful pivots on the weekly too, just spaced further apart in calendar time. If one timeframe is over- or under-detecting, adjust the slope tolerance rather than the pivot length.
Higher-timeframe pivots don't confirm until pivot length bars after the actual high or low. On Weekly with length 9, that's nine weeks of delay between the swing and the channel appearing. Geometry is non-repainting once it prints.
When no channel appears on a timeframe, it usually means either (a) fewer than two pivot highs and two pivot lows have accumulated, or (b) the pivots that exist don't form a parallel structure within tolerance. Both are normal states. Lower the pivot length to speed up (a); raise the slope tolerance to relax (b).
This is a structural tool, not a signal generator. It surfaces validated parallel channels on each higher timeframe and flags when price has broken them.
Five years of work on a trading system left me with dozens of indicators that ultimately didn't earn a place in the final build. They're not failures — they're tools that solved problems I no longer needed solved. So instead of shelving them, I'm publishing the majority of them open-source.
If you're a discretionary trader, take what's useful. If you're a systems builder, the source is yours to dissect, modify, and improve. The best return on five years of work is for it to keep working — for someone.
If you use this script — or part of it — in your own work, please credit the original with a link back to my profile.
Note: these indicators have been updated to Pine Script v6 — some manually, some with AI assistance.
Script de código aberto
Em verdadeiro espírito do TradingView, o criador deste script o tornou de código aberto, para que os traders possam revisar e verificar sua funcionalidade. Parabéns ao autor! Embora você possa usá-lo gratuitamente, lembre-se de que a republicação do código está sujeita às nossas Regras da Casa.

Aviso legal
As informações e publicações não se destinam a ser, e não constituem, conselhos ou recomendações financeiras, de investimento, comerciais ou de outro tipo fornecidos ou endossados pela TradingView. Leia mais nos Termos de Uso.
Script de código aberto
Em verdadeiro espírito do TradingView, o criador deste script o tornou de código aberto, para que os traders possam revisar e verificar sua funcionalidade. Parabéns ao autor! Embora você possa usá-lo gratuitamente, lembre-se de que a republicação do código está sujeita às nossas Regras da Casa.
Aviso legal
As informações e publicações não se destinam a ser, e não constituem, conselhos ou recomendações financeiras, de investimento, comerciais ou de outro tipo fornecidos ou endossados pela TradingView. Leia mais nos Termos de Uso.