OPEN-SOURCE SCRIPT
Price change area
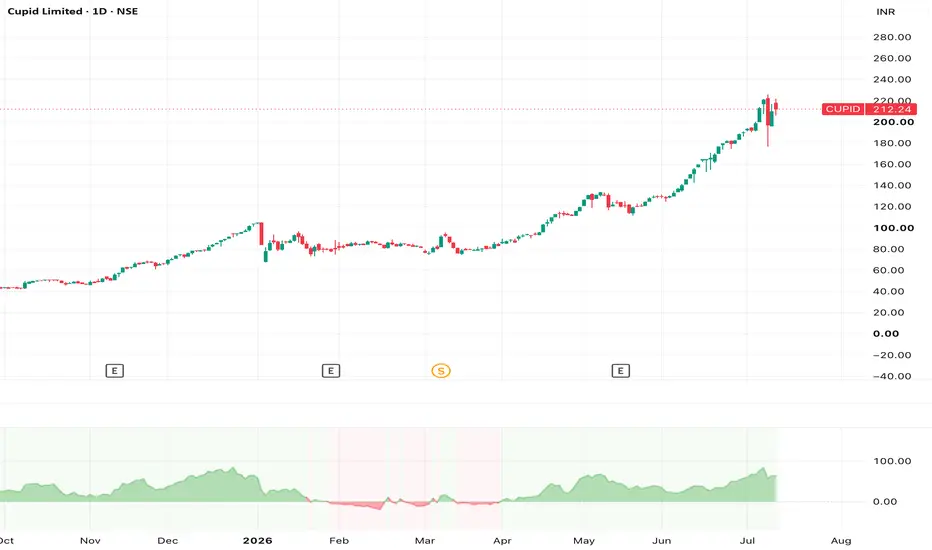
This indicator visualizes how much the price has changed over a configurable lookback period, displayed as a continuous area in a separate pane.
Features
• Two calculation modes:
• Exact % change – compares today’s close to the close exactly y bars ago.
• Max % change – shows the largest % move from an extreme (lowest or highest close) in the last y bars to today’s close.
• Configurable lookback: set the number of bars y (default: 30).
• Y-axis scale options:
• Ratio – displays values like 0.33 , -0.20 (i.e., +33%, −20%).
• Percent – displays values like 33.3 , -20.0 .
• Color-coded area:
• Green for positive change (price up over the lookback).
• Red for negative change (price down over the lookback).
• Zero line = no change.
How it works
• Uses closing prices only.
• For each bar, computes:
• Exact mode:
• Max mode:
• Finds lowest and highest close in the last y bars.
• Calculates up and down ratios from those extremes to today’s close.
• Plots the one with the larger absolute deviation from 1.
• Plots (ratio − 1) (or (ratio − 1) × 100 in Percent mode) as a filled area around the zero line.
Use cases
• Quickly spot strong up/down moves over a chosen period.
• Study historical volatility and momentum in terms of % change.
• Compare how different stocks or timeframes behave over similar lookback windows.
Inputs
• Lookback bars (y): number of bars to consider (default 30).
• Calculation Mode: “Exact % change” or “Max % change”.
• Y-Axis Scale: “Ratio” or “Percent”.
Features
• Two calculation modes:
• Exact % change – compares today’s close to the close exactly y bars ago.
• Max % change – shows the largest % move from an extreme (lowest or highest close) in the last y bars to today’s close.
• Configurable lookback: set the number of bars y (default: 30).
• Y-axis scale options:
• Ratio – displays values like 0.33 , -0.20 (i.e., +33%, −20%).
• Percent – displays values like 33.3 , -20.0 .
• Color-coded area:
• Green for positive change (price up over the lookback).
• Red for negative change (price down over the lookback).
• Zero line = no change.
How it works
• Uses closing prices only.
• For each bar, computes:
• Exact mode:
• Max mode:
• Finds lowest and highest close in the last y bars.
• Calculates up and down ratios from those extremes to today’s close.
• Plots the one with the larger absolute deviation from 1.
• Plots (ratio − 1) (or (ratio − 1) × 100 in Percent mode) as a filled area around the zero line.
Use cases
• Quickly spot strong up/down moves over a chosen period.
• Study historical volatility and momentum in terms of % change.
• Compare how different stocks or timeframes behave over similar lookback windows.
Inputs
• Lookback bars (y): number of bars to consider (default 30).
• Calculation Mode: “Exact % change” or “Max % change”.
• Y-Axis Scale: “Ratio” or “Percent”.
Script de código aberto
Em verdadeiro espírito do TradingView, o criador deste script o tornou de código aberto, para que os traders possam revisar e verificar sua funcionalidade. Parabéns ao autor! Embora você possa usá-lo gratuitamente, lembre-se de que a republicação do código está sujeita às nossas Regras da Casa.

Aviso legal
As informações e publicações não se destinam a ser, e não constituem, conselhos ou recomendações financeiras, de investimento, comerciais ou de outro tipo fornecidos ou endossados pela TradingView. Leia mais nos Termos de Uso.
Script de código aberto
Em verdadeiro espírito do TradingView, o criador deste script o tornou de código aberto, para que os traders possam revisar e verificar sua funcionalidade. Parabéns ao autor! Embora você possa usá-lo gratuitamente, lembre-se de que a republicação do código está sujeita às nossas Regras da Casa.
Aviso legal
As informações e publicações não se destinam a ser, e não constituem, conselhos ou recomendações financeiras, de investimento, comerciais ou de outro tipo fornecidos ou endossados pela TradingView. Leia mais nos Termos de Uso.