Atualizado
Eye Level Strength [EyeAlgo]
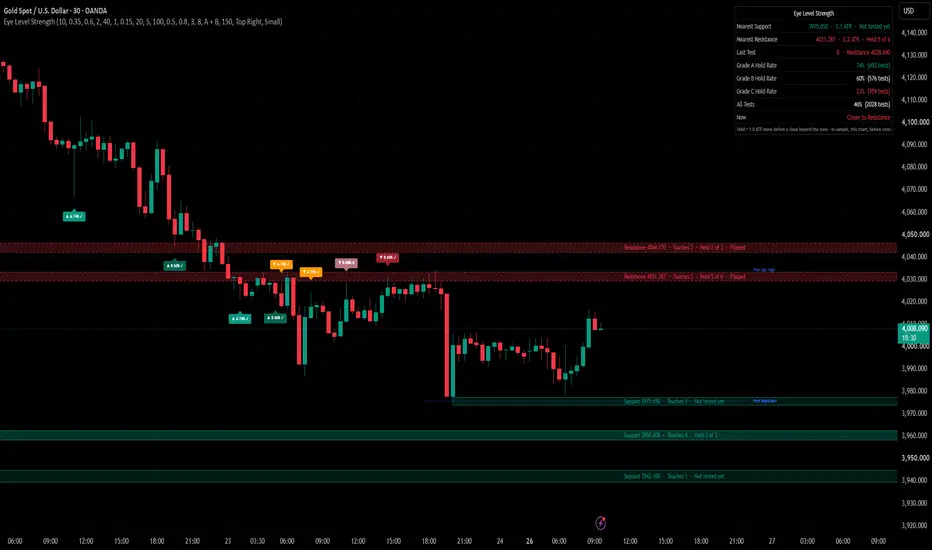
Eye Level Strength draws support and resistance zones from confirmed swings, grades every test of a zone A, B or C at the close of the test candle, and shows how often each grade has held on the chart you are looking at.

Why grade the test, not the level
Most S/R tools rate a level by how many touches it has, how old it is or how much volume traded there. While building this script we measured those level features on gold, silver, EURUSD, BTCUSD and NAS100: levels with one, two or three+ touches all held between about 42% and 52% of the time, with no clear order. What made a clear difference was the test itself: how the candle closed at the zone, how long its rejection wick was, and whether the test went with the trend. So this indicator keeps the levels simple and puts the grade on each test.
It answers three questions:
▶ Where are the nearest support and resistance zones, and how did they do in past tests?
▶ Is the test happening right now a strong one (A) or a weak one (C)?
▶ On this symbol and timeframe, how often did A, B and C tests hold?
What is different here
▶ A grade on every test, known at the close of the test candle, with the measured hold rate of that grade printed on the marker.
▶ Each marker is marked ✓ (held) or ✕ (broke) when its test resolves, so the chart history shows the result of each graded test. Tests with no result inside the test window stay unmarked.
▶ The hold rate per grade is counted live on your chart, not taken from a fixed table.
▶ Broken levels flip (support ↔ resistance), are drawn dashed, and a test of a flipped level is shown as a retest in its own colour.
▶ Previous day and previous week high/low lines for context (previous day lines below daily charts, previous week lines below weekly charts).
▶ Only the nearest levels are drawn, so the chart stays clean.
How it works
1. Levels: confirmed pivot highs and lows ("Pivot Length (left = right)") become zones "Zone Width (x ATR)" wide. A new swing within "Merge Distance (x ATR)" of an existing level adds a touch to it instead of making a new level.
2. Test: a test starts when the previous candle closed outside the zone and the current candle trades into it. "Test Cooldown (bars)" stops the same level from being tested on every bar.
3. Grade: at the close of the test candle, points are added: close back outside the zone on the side it came from 3 (close inside the zone 1), rejection wick of at least "Long Wick = Wick ≥ (x candle range)" of the candle range 2 (half of that 1), test in the direction of the trend 2 (against the trend 1, flat 0), calm market (setting "Calm Market = ATR ≤ (x its 100-bar average)") 1. A = 6 or more, B = 4-5, C = 3 or less. Trend = close above a rising EMA ("Trend EMA Length") for support tests, below a falling EMA for resistance tests.
4. Result: HELD if price moves "Hold = Move Away of (x ATR)" away from the zone before any candle closes beyond the far side of the zone by "Break = Close Beyond Zone + (x ATR)". BROKE if that close comes first. If neither happens within "Test Window (bars)", the test has no result and is not counted.
5. Levels after a break: a close beyond the zone by the break buffer (during a test or not) flips the level and it is drawn dashed. After "Remove Level After Breaks" breaks it is removed.

What the dashboard showed in testing
Default settings, 30 minutes unless noted, the history TradingView loads (checked 26 Oct 2026):
▶ OANDA:XAUUSD 30m: A 74% (n 493), B 60% (n 576), C 23% (n 959).
▶ OANDA:XAUUSD 15m / 1H / 4H: A 68% / 72% / 69%, C 19% / 22% / 22%.
▶ OANDA:XAGUSD: A 70%, B 65%, C 23%. OANDA:EURUSD: A 72%, B 65%, C 22%.
▶ COINBASE:BTCUSD: A 73%, B 67%, C 22%. OANDA:NAS100USD: A 72%, B 60%, C 22%.
A "hold" here is a move of 1 ATR away from the zone, not a trade result: there is no stop, no target and no spread or commission in these numbers. They are in-sample, describe the past on these charts and are not a promise of future results. Check the dashboard on your own symbol and timeframe.
How to use
1. Add the indicator and look at the nearest zones and their "Held X of Y" record.
2. When price comes into a zone, wait for the test candle to close. The marker shows the grade and the hold rate of that grade so far.
3. Grade A at support in an uptrend (or at resistance in a downtrend) is the case that held most often in testing.
4. Grade C means the zone was weak on that test; in testing those zones broke far more often than they held, so treat a C as a warning, not as an entry.
5. Use your own entry, stop and target rules. The indicator only measures the reaction.
6. Set alerts (below) instead of watching the chart.
How to change settings
Open the settings by double-clicking the indicator name.
Quick guide:
▶ More or fewer levels → "Pivot Length (left = right)" (higher = fewer, bigger swings) and "Levels Shown per Side".
▶ Wider or narrower zones → "Zone Width (x ATR)".
▶ Stricter "held" → raise "Hold = Move Away of (x ATR)".
▶ Cleaner chart → "Test Markers" = "A only", or turn off "Show Level Labels" or "Show Prev Day / Week High-Low Lines".
▶ Trend filter speed → "Trend EMA Length".
Settings
▶ Levels: Pivot Length, Zone Width, Merge Distance, Remove Level After Breaks, Max Levels Tracked.
▶ Test Rules: Hold = Move Away of (x ATR), Break = Close Beyond Zone + (x ATR), Test Window (bars), Test Cooldown (bars).
▶ Test Grade: Trend EMA Length, Long Wick, Calm Market.
▶ Display: Levels Shown per Side, Hide Levels Beyond (x ATR), Show Level Labels, Test Markers (A only / A + B / All / None), Markers Kept on Chart, Show Prev Day / Week High-Low Lines, Show Dashboard, Dashboard Position, Text Size.
▶ Colors: Support, Resistance, Retest of Flipped Level, Prev Day / Week, Failed Test.
Alerts
▶ Grade A Support Test / Grade A Resistance Test
▶ Support Test (any grade) / Resistance Test (any grade)
▶ Retest of Flipped Level
▶ Support Break / Resistance Break
For one alert with full details, choose "Any alert() function call": it sends each test with its level price, grade and the hold rate of that grade, and each break with the level price. All alerts are checked on bar close.
Notes and limits
▶ Levels come from confirmed pivots, so a level appears "Pivot Length (left = right)" bars after the swing. Grades and results use closed candles only and do not repaint.
▶ The hold rates use only the bars loaded on your chart, so they change when you change symbol, timeframe or settings. Early on a marker can show "learning" until a grade has results.
▶ Tests without a result inside the test window are not counted.
▶ Volume is not used, so it works the same on symbols without real volume.
▶ Only the nearest levels within "Hide Levels Beyond (x ATR)" are drawn; the oldest test markers are removed first once "Markers Kept on Chart" is reached.
▶ The indicator does not place trades.
Disclaimer
For education and research only. This is not financial advice. Past results on a chart do not guarantee future results. Test the settings and the timeframe on your own instrument before using any idea from it.
Why grade the test, not the level
Most S/R tools rate a level by how many touches it has, how old it is or how much volume traded there. While building this script we measured those level features on gold, silver, EURUSD, BTCUSD and NAS100: levels with one, two or three+ touches all held between about 42% and 52% of the time, with no clear order. What made a clear difference was the test itself: how the candle closed at the zone, how long its rejection wick was, and whether the test went with the trend. So this indicator keeps the levels simple and puts the grade on each test.
It answers three questions:
▶ Where are the nearest support and resistance zones, and how did they do in past tests?
▶ Is the test happening right now a strong one (A) or a weak one (C)?
▶ On this symbol and timeframe, how often did A, B and C tests hold?
What is different here
▶ A grade on every test, known at the close of the test candle, with the measured hold rate of that grade printed on the marker.
▶ Each marker is marked ✓ (held) or ✕ (broke) when its test resolves, so the chart history shows the result of each graded test. Tests with no result inside the test window stay unmarked.
▶ The hold rate per grade is counted live on your chart, not taken from a fixed table.
▶ Broken levels flip (support ↔ resistance), are drawn dashed, and a test of a flipped level is shown as a retest in its own colour.
▶ Previous day and previous week high/low lines for context (previous day lines below daily charts, previous week lines below weekly charts).
▶ Only the nearest levels are drawn, so the chart stays clean.
How it works
1. Levels: confirmed pivot highs and lows ("Pivot Length (left = right)") become zones "Zone Width (x ATR)" wide. A new swing within "Merge Distance (x ATR)" of an existing level adds a touch to it instead of making a new level.
2. Test: a test starts when the previous candle closed outside the zone and the current candle trades into it. "Test Cooldown (bars)" stops the same level from being tested on every bar.
3. Grade: at the close of the test candle, points are added: close back outside the zone on the side it came from 3 (close inside the zone 1), rejection wick of at least "Long Wick = Wick ≥ (x candle range)" of the candle range 2 (half of that 1), test in the direction of the trend 2 (against the trend 1, flat 0), calm market (setting "Calm Market = ATR ≤ (x its 100-bar average)") 1. A = 6 or more, B = 4-5, C = 3 or less. Trend = close above a rising EMA ("Trend EMA Length") for support tests, below a falling EMA for resistance tests.
4. Result: HELD if price moves "Hold = Move Away of (x ATR)" away from the zone before any candle closes beyond the far side of the zone by "Break = Close Beyond Zone + (x ATR)". BROKE if that close comes first. If neither happens within "Test Window (bars)", the test has no result and is not counted.
5. Levels after a break: a close beyond the zone by the break buffer (during a test or not) flips the level and it is drawn dashed. After "Remove Level After Breaks" breaks it is removed.
What the dashboard showed in testing
Default settings, 30 minutes unless noted, the history TradingView loads (checked 26 Oct 2026):
▶ OANDA:XAUUSD 30m: A 74% (n 493), B 60% (n 576), C 23% (n 959).
▶ OANDA:XAUUSD 15m / 1H / 4H: A 68% / 72% / 69%, C 19% / 22% / 22%.
▶ OANDA:XAGUSD: A 70%, B 65%, C 23%. OANDA:EURUSD: A 72%, B 65%, C 22%.
▶ COINBASE:BTCUSD: A 73%, B 67%, C 22%. OANDA:NAS100USD: A 72%, B 60%, C 22%.
A "hold" here is a move of 1 ATR away from the zone, not a trade result: there is no stop, no target and no spread or commission in these numbers. They are in-sample, describe the past on these charts and are not a promise of future results. Check the dashboard on your own symbol and timeframe.
How to use
1. Add the indicator and look at the nearest zones and their "Held X of Y" record.
2. When price comes into a zone, wait for the test candle to close. The marker shows the grade and the hold rate of that grade so far.
3. Grade A at support in an uptrend (or at resistance in a downtrend) is the case that held most often in testing.
4. Grade C means the zone was weak on that test; in testing those zones broke far more often than they held, so treat a C as a warning, not as an entry.
5. Use your own entry, stop and target rules. The indicator only measures the reaction.
6. Set alerts (below) instead of watching the chart.
How to change settings
Open the settings by double-clicking the indicator name.
Quick guide:
▶ More or fewer levels → "Pivot Length (left = right)" (higher = fewer, bigger swings) and "Levels Shown per Side".
▶ Wider or narrower zones → "Zone Width (x ATR)".
▶ Stricter "held" → raise "Hold = Move Away of (x ATR)".
▶ Cleaner chart → "Test Markers" = "A only", or turn off "Show Level Labels" or "Show Prev Day / Week High-Low Lines".
▶ Trend filter speed → "Trend EMA Length".
Settings
▶ Levels: Pivot Length, Zone Width, Merge Distance, Remove Level After Breaks, Max Levels Tracked.
▶ Test Rules: Hold = Move Away of (x ATR), Break = Close Beyond Zone + (x ATR), Test Window (bars), Test Cooldown (bars).
▶ Test Grade: Trend EMA Length, Long Wick, Calm Market.
▶ Display: Levels Shown per Side, Hide Levels Beyond (x ATR), Show Level Labels, Test Markers (A only / A + B / All / None), Markers Kept on Chart, Show Prev Day / Week High-Low Lines, Show Dashboard, Dashboard Position, Text Size.
▶ Colors: Support, Resistance, Retest of Flipped Level, Prev Day / Week, Failed Test.
Alerts
▶ Grade A Support Test / Grade A Resistance Test
▶ Support Test (any grade) / Resistance Test (any grade)
▶ Retest of Flipped Level
▶ Support Break / Resistance Break
For one alert with full details, choose "Any alert() function call": it sends each test with its level price, grade and the hold rate of that grade, and each break with the level price. All alerts are checked on bar close.
Notes and limits
▶ Levels come from confirmed pivots, so a level appears "Pivot Length (left = right)" bars after the swing. Grades and results use closed candles only and do not repaint.
▶ The hold rates use only the bars loaded on your chart, so they change when you change symbol, timeframe or settings. Early on a marker can show "learning" until a grade has results.
▶ Tests without a result inside the test window are not counted.
▶ Volume is not used, so it works the same on symbols without real volume.
▶ Only the nearest levels within "Hide Levels Beyond (x ATR)" are drawn; the oldest test markers are removed first once "Markers Kept on Chart" is reached.
▶ The indicator does not place trades.
Disclaimer
For education and research only. This is not financial advice. Past results on a chart do not guarantee future results. Test the settings and the timeframe on your own instrument before using any idea from it.
Notas de Lançamento
Fix: runtime error "The requested historical offset is beyond the historical buffer's limit" on charts with a long history (zones drawn from older swings). The script now reserves a 5000-bar history buffer. No change to levels, grades, statistics or inputs.
Aviso legal
As informações e publicações não se destinam a ser, e não constituem, conselhos ou recomendações financeiras, de investimento, comerciais ou de outro tipo fornecidos ou endossados pela TradingView. Leia mais nos Termos de Uso.
Aviso legal
As informações e publicações não se destinam a ser, e não constituem, conselhos ou recomendações financeiras, de investimento, comerciais ou de outro tipo fornecidos ou endossados pela TradingView. Leia mais nos Termos de Uso.