Equalhigh Perfect Channel V3.1
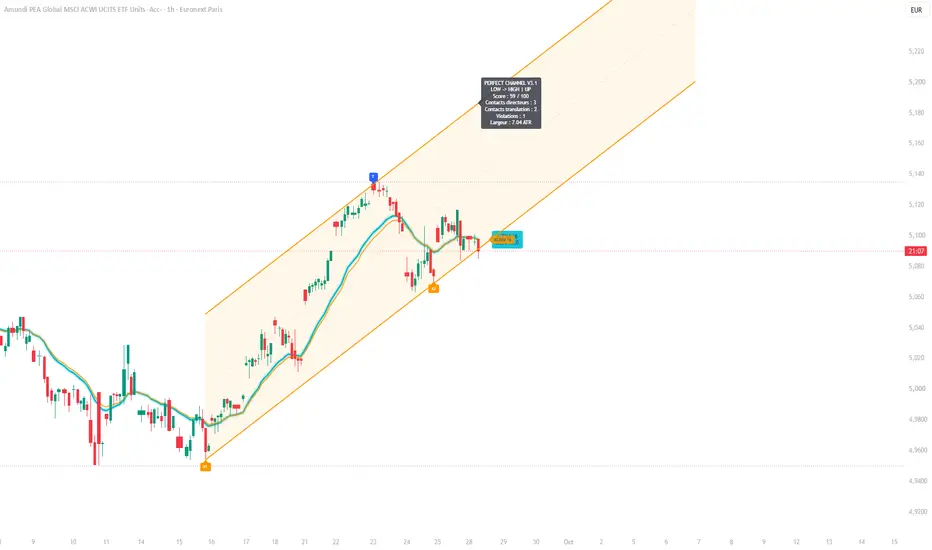
EQUALHIGH PERFECT CHANNEL V3.1
User Manual
============================================================
PURPOSE
Equalhigh Perfect Channel automatically detects geometrically clean
parallel price channels.
The indicator does NOT calculate two independent trendlines.
Instead, it:
1. Detects a valid directional trendline using significant price pivots.
2. Calculates its exact slope.
3. Translates this same line vertically toward the opposite price extreme.
4. Creates a second line with EXACTLY the same slope.
5. Scores the resulting channel according to contacts, cleanliness,
duration and current relevance.
The result is a mathematically parallel channel similar to a manually
drawn "perfect channel".
============================================================
CHANNEL CONSTRUCTION
============================================================
The indicator can build channels in four different ways:
HIGH -> LOW
A resistance line is created from significant HIGH pivots.
The same line is then translated downward until it touches the most
extreme LOW.
CLOSE HIGH -> LOW
Same principle, but the upper directional line is constructed from
closing-price swing highs instead of candle wicks.
LOW -> HIGH
A support line is created from significant LOW pivots.
The same line is then translated upward until it reaches the most
extreme HIGH.
CLOSE LOW -> HIGH
Same principle, but the lower directional line is constructed from
closing-price swing lows.
AUTO
The indicator tests all four methods and keeps the highest-quality
valid channel.
============================================================
IMPORTANT GEOMETRIC PRINCIPLE
============================================================
A1 and A2 define the slope of the channel.
T defines only the vertical translation.
T NEVER changes the slope.
Therefore:
Upper Line Slope = Lower Line Slope
This is the core principle of the Equalhigh Perfect Channel.
============================================================
CHART LABELS
============================================================
A1
First anchor point used to define the directional trendline.
A2
Second anchor point used to define the directional trendline.
T
Translation / Tangency point.
For an upper-anchored channel, T is the LOW that determines the lower
parallel line.
For a lower-anchored channel, T is the HIGH that determines the upper
parallel line.
============================================================
INPUTS
============================================================
CONSTRUCTION
AUTO
Recommended default.
Tests all supported channel construction methods.
UPPER HIGH
Uses candle highs to construct the upper trendline.
UPPER CLOSE
Uses closing prices to construct the upper trendline.
LOWER LOW
Uses candle lows to construct the lower trendline.
LOWER CLOSE
Uses closing prices to construct the lower trendline.
PIVOT LEFT / PIVOT RIGHT
Controls how significant a swing point must be before it can be used
as a channel anchor.
Lower values:
- More sensitive
- More channels
- More short-term structures
- More noise
Higher values:
- Fewer pivots
- More important swing points
- Better suited to major channels
LOOKBACK
Defines how far back the algorithm searches for valid channel
structures.
Example:
100-150 bars:
Short-term structures
200-350 bars:
Medium-term structures
400+ bars:
Major long-term channels
PIVOTS TESTED
Defines the number of recent significant pivots used by the search
engine.
Increasing this value improves the search depth but also increases
calculation time.
============================================================
ATR TOLERANCES
============================================================
The indicator uses ATR instead of a fixed percentage so the detection
automatically adapts to market volatility.
DIRECTING LINE TOLERANCE
Defines how close price must be to the directional line to count as
a valid contact.
Default:
0.20 ATR
TRANSLATED LINE TOLERANCE
Defines how close price must be to the translated parallel line to
count as a valid contact.
Default:
0.25 ATR
BREAK TOLERANCE
Defines how far price may exceed the directional line before the event
is considered a violation.
Default:
0.30 ATR
============================================================
DISTINCT CONTACTS
============================================================
Several candles touching the same area must NOT automatically count as
several independent confirmations.
The "Minimum separation between contacts" parameter groups nearby
touches into one contact cluster.
Example:
Five consecutive candles touching the same resistance area may count
as only ONE structural contact.
Three touches separated by several bars may count as THREE independent
contacts.
This prevents false high scores caused by price clustering around one
single pivot.
============================================================
MINIMUM DIRECTING CONTACTS
============================================================
Defines the minimum number of distinct contacts required on the
directional line.
Recommended:
2
Very permissive.
Useful for early channel detection.
3
Recommended default.
Good compromise between early detection and structural confirmation.
4+
Strong confirmation, but fewer channels will be detected.
============================================================
TRANSLATED LINE CONTACTS
============================================================
Defines how many independent contacts are required on the translated
parallel boundary.
A value of 1 allows the translation point T itself to validate the
opposite side.
Higher values require repeated interaction with both sides of the
channel.
============================================================
VIOLATIONS
============================================================
A violation occurs when price exceeds the directing line by more than
the ATR break tolerance.
Lower maximum violations:
Cleaner and more selective channels.
Higher maximum violations:
More tolerant channels.
Recommended default:
1
============================================================
CHANNEL WIDTH
============================================================
Minimum Channel Width is expressed in ATR.
This prevents extremely narrow structures from being classified as
meaningful price channels.
Example:
0.50 ATR
Allows relatively narrow channels.
1.00 ATR+
Requires broader structures.
============================================================
CHANNEL DIRECTION
============================================================
The indicator can independently search for:
UP channels
Ascending structures.
DOWN channels
Descending structures.
FLAT channels
Approximately horizontal structures.
The Flat Threshold defines when a slope is small enough to be
classified as horizontal.
============================================================
ONLY ACTIVE CHANNEL
============================================================
When disabled:
The algorithm may display the best historical structure even if price
has recently moved outside it.
When enabled:
Only channels that still contain the current market price within the
allowed tolerance are accepted.
Enable this option when using the indicator primarily for current
trading decisions.
============================================================
PERFECT CHANNEL SCORE
============================================================
Every candidate channel receives a score from 0 to 100.
The score considers:
- Number of independent contacts on the directing line
- Number of contacts on the translated line
- Channel duration
- Number of structural violations
- Whether price is still trading inside the channel
Higher scores generally represent cleaner and more statistically
convincing channel geometry.
GENERAL INTERPRETATION
Below 50
Weak or insufficient structure.
50-64
Acceptable channel.
65-79
Good structural channel.
80-89
Very strong channel.
90-100
Exceptional geometric structure.
The score is a structural quality measure.
It is NOT a prediction of future price direction.
============================================================
DISPLAY OPTIONS
============================================================
PROJECTION TO THE RIGHT
Extends both parallel boundaries into the future without modifying
their slope.
This is useful for identifying potential future support or resistance
areas.
MEDIAN LINE
Displays the exact midpoint of the channel.
The median can behave as:
- equilibrium area
- intermediate support
- intermediate resistance
- mean-reversion reference
CHANNEL FILL
Colors the area located between the two parallel boundaries.
ANCHORS
Displays:
A1 = First directing anchor
A2 = Second directing anchor
T = Translation point
============================================================
RECOMMENDED DEFAULT SETTINGS
============================================================
Construction:
AUTO
Pivot Left:
5
Pivot Right:
5
Lookback:
300
Pivots Tested:
12
ATR:
14
Directing Line Tolerance:
0.20 ATR
Translated Line Tolerance:
0.25 ATR
Break Tolerance:
0.30 ATR
Minimum Separation Between Contacts:
6 bars
Minimum Directing Contacts:
3
Minimum Translated Contacts:
1
Maximum Violations:
1
Minimum Channel Width:
0.50 ATR
Minimum Score:
50
============================================================
TIMEFRAME GUIDELINES
============================================================
The indicator is timeframe-independent.
However, settings may need to be adapted to the market and timeframe.
Intraday:
Use smaller lookbacks and possibly smaller pivot values.
Daily:
The default configuration is a good starting point.
Weekly:
Use larger lookbacks and potentially larger pivot values to detect
major structural channels.
============================================================
HOW TO INTERPRET A CHANNEL
============================================================
A detected channel should be treated as a geometric market structure,
not as a standalone buy or sell signal.
Potential interpretations include:
Price near lower boundary:
Possible support / favorable risk-reward area in an ascending or flat
channel.
Price near upper boundary:
Possible resistance / stretched area.
Price near median:
Neutral or equilibrium zone.
Confirmed breakout above the channel:
The previous channel geometry may no longer be valid.
Confirmed breakdown below the channel:
The previous channel geometry may no longer be valid.
============================================================
HIGH vs CLOSE
============================================================
HIGH / LOW modes respect candle extremes and are useful when wicks
clearly define market structure.
CLOSE modes are useful when candle extremes are noisy but closing
prices repeatedly respect a cleaner trendline.
AUTO lets the algorithm decide which representation produces the
strongest valid channel.
============================================================
LIMITATIONS
============================================================
No automatically detected channel is guaranteed to remain valid.
A high score means the historical geometry is clean.
It does NOT guarantee that price will continue respecting the channel.
Channel quality may change after:
- earnings
- macroeconomic events
- gaps
- major news
- volatility regime changes
- structural trend breaks
Always combine channel analysis with price action, market structure,
volume, fundamentals or other confirmation tools when appropriate.
============================================================
DESIGN PHILOSOPHY
============================================================
Equalhigh Perfect Channel is based on one simple rule:
"Find the slope first. Translate it second."
The opposite side of the channel is never independently fitted.
This preserves perfect geometric parallelism and reproduces the way
high-quality manual price channels are traditionally constructed.
Equalhigh
Perfect Channel V3.1
User Manual
============================================================
PURPOSE
Equalhigh Perfect Channel automatically detects geometrically clean
parallel price channels.
The indicator does NOT calculate two independent trendlines.
Instead, it:
1. Detects a valid directional trendline using significant price pivots.
2. Calculates its exact slope.
3. Translates this same line vertically toward the opposite price extreme.
4. Creates a second line with EXACTLY the same slope.
5. Scores the resulting channel according to contacts, cleanliness,
duration and current relevance.
The result is a mathematically parallel channel similar to a manually
drawn "perfect channel".
============================================================
CHANNEL CONSTRUCTION
============================================================
The indicator can build channels in four different ways:
HIGH -> LOW
A resistance line is created from significant HIGH pivots.
The same line is then translated downward until it touches the most
extreme LOW.
CLOSE HIGH -> LOW
Same principle, but the upper directional line is constructed from
closing-price swing highs instead of candle wicks.
LOW -> HIGH
A support line is created from significant LOW pivots.
The same line is then translated upward until it reaches the most
extreme HIGH.
CLOSE LOW -> HIGH
Same principle, but the lower directional line is constructed from
closing-price swing lows.
AUTO
The indicator tests all four methods and keeps the highest-quality
valid channel.
============================================================
IMPORTANT GEOMETRIC PRINCIPLE
============================================================
A1 and A2 define the slope of the channel.
T defines only the vertical translation.
T NEVER changes the slope.
Therefore:
Upper Line Slope = Lower Line Slope
This is the core principle of the Equalhigh Perfect Channel.
============================================================
CHART LABELS
============================================================
A1
First anchor point used to define the directional trendline.
A2
Second anchor point used to define the directional trendline.
T
Translation / Tangency point.
For an upper-anchored channel, T is the LOW that determines the lower
parallel line.
For a lower-anchored channel, T is the HIGH that determines the upper
parallel line.
============================================================
INPUTS
============================================================
CONSTRUCTION
AUTO
Recommended default.
Tests all supported channel construction methods.
UPPER HIGH
Uses candle highs to construct the upper trendline.
UPPER CLOSE
Uses closing prices to construct the upper trendline.
LOWER LOW
Uses candle lows to construct the lower trendline.
LOWER CLOSE
Uses closing prices to construct the lower trendline.
PIVOT LEFT / PIVOT RIGHT
Controls how significant a swing point must be before it can be used
as a channel anchor.
Lower values:
- More sensitive
- More channels
- More short-term structures
- More noise
Higher values:
- Fewer pivots
- More important swing points
- Better suited to major channels
LOOKBACK
Defines how far back the algorithm searches for valid channel
structures.
Example:
100-150 bars:
Short-term structures
200-350 bars:
Medium-term structures
400+ bars:
Major long-term channels
PIVOTS TESTED
Defines the number of recent significant pivots used by the search
engine.
Increasing this value improves the search depth but also increases
calculation time.
============================================================
ATR TOLERANCES
============================================================
The indicator uses ATR instead of a fixed percentage so the detection
automatically adapts to market volatility.
DIRECTING LINE TOLERANCE
Defines how close price must be to the directional line to count as
a valid contact.
Default:
0.20 ATR
TRANSLATED LINE TOLERANCE
Defines how close price must be to the translated parallel line to
count as a valid contact.
Default:
0.25 ATR
BREAK TOLERANCE
Defines how far price may exceed the directional line before the event
is considered a violation.
Default:
0.30 ATR
============================================================
DISTINCT CONTACTS
============================================================
Several candles touching the same area must NOT automatically count as
several independent confirmations.
The "Minimum separation between contacts" parameter groups nearby
touches into one contact cluster.
Example:
Five consecutive candles touching the same resistance area may count
as only ONE structural contact.
Three touches separated by several bars may count as THREE independent
contacts.
This prevents false high scores caused by price clustering around one
single pivot.
============================================================
MINIMUM DIRECTING CONTACTS
============================================================
Defines the minimum number of distinct contacts required on the
directional line.
Recommended:
2
Very permissive.
Useful for early channel detection.
3
Recommended default.
Good compromise between early detection and structural confirmation.
4+
Strong confirmation, but fewer channels will be detected.
============================================================
TRANSLATED LINE CONTACTS
============================================================
Defines how many independent contacts are required on the translated
parallel boundary.
A value of 1 allows the translation point T itself to validate the
opposite side.
Higher values require repeated interaction with both sides of the
channel.
============================================================
VIOLATIONS
============================================================
A violation occurs when price exceeds the directing line by more than
the ATR break tolerance.
Lower maximum violations:
Cleaner and more selective channels.
Higher maximum violations:
More tolerant channels.
Recommended default:
1
============================================================
CHANNEL WIDTH
============================================================
Minimum Channel Width is expressed in ATR.
This prevents extremely narrow structures from being classified as
meaningful price channels.
Example:
0.50 ATR
Allows relatively narrow channels.
1.00 ATR+
Requires broader structures.
============================================================
CHANNEL DIRECTION
============================================================
The indicator can independently search for:
UP channels
Ascending structures.
DOWN channels
Descending structures.
FLAT channels
Approximately horizontal structures.
The Flat Threshold defines when a slope is small enough to be
classified as horizontal.
============================================================
ONLY ACTIVE CHANNEL
============================================================
When disabled:
The algorithm may display the best historical structure even if price
has recently moved outside it.
When enabled:
Only channels that still contain the current market price within the
allowed tolerance are accepted.
Enable this option when using the indicator primarily for current
trading decisions.
============================================================
PERFECT CHANNEL SCORE
============================================================
Every candidate channel receives a score from 0 to 100.
The score considers:
- Number of independent contacts on the directing line
- Number of contacts on the translated line
- Channel duration
- Number of structural violations
- Whether price is still trading inside the channel
Higher scores generally represent cleaner and more statistically
convincing channel geometry.
GENERAL INTERPRETATION
Below 50
Weak or insufficient structure.
50-64
Acceptable channel.
65-79
Good structural channel.
80-89
Very strong channel.
90-100
Exceptional geometric structure.
The score is a structural quality measure.
It is NOT a prediction of future price direction.
============================================================
DISPLAY OPTIONS
============================================================
PROJECTION TO THE RIGHT
Extends both parallel boundaries into the future without modifying
their slope.
This is useful for identifying potential future support or resistance
areas.
MEDIAN LINE
Displays the exact midpoint of the channel.
The median can behave as:
- equilibrium area
- intermediate support
- intermediate resistance
- mean-reversion reference
CHANNEL FILL
Colors the area located between the two parallel boundaries.
ANCHORS
Displays:
A1 = First directing anchor
A2 = Second directing anchor
T = Translation point
============================================================
RECOMMENDED DEFAULT SETTINGS
============================================================
Construction:
AUTO
Pivot Left:
5
Pivot Right:
5
Lookback:
300
Pivots Tested:
12
ATR:
14
Directing Line Tolerance:
0.20 ATR
Translated Line Tolerance:
0.25 ATR
Break Tolerance:
0.30 ATR
Minimum Separation Between Contacts:
6 bars
Minimum Directing Contacts:
3
Minimum Translated Contacts:
1
Maximum Violations:
1
Minimum Channel Width:
0.50 ATR
Minimum Score:
50
============================================================
TIMEFRAME GUIDELINES
============================================================
The indicator is timeframe-independent.
However, settings may need to be adapted to the market and timeframe.
Intraday:
Use smaller lookbacks and possibly smaller pivot values.
Daily:
The default configuration is a good starting point.
Weekly:
Use larger lookbacks and potentially larger pivot values to detect
major structural channels.
============================================================
HOW TO INTERPRET A CHANNEL
============================================================
A detected channel should be treated as a geometric market structure,
not as a standalone buy or sell signal.
Potential interpretations include:
Price near lower boundary:
Possible support / favorable risk-reward area in an ascending or flat
channel.
Price near upper boundary:
Possible resistance / stretched area.
Price near median:
Neutral or equilibrium zone.
Confirmed breakout above the channel:
The previous channel geometry may no longer be valid.
Confirmed breakdown below the channel:
The previous channel geometry may no longer be valid.
============================================================
HIGH vs CLOSE
============================================================
HIGH / LOW modes respect candle extremes and are useful when wicks
clearly define market structure.
CLOSE modes are useful when candle extremes are noisy but closing
prices repeatedly respect a cleaner trendline.
AUTO lets the algorithm decide which representation produces the
strongest valid channel.
============================================================
LIMITATIONS
============================================================
No automatically detected channel is guaranteed to remain valid.
A high score means the historical geometry is clean.
It does NOT guarantee that price will continue respecting the channel.
Channel quality may change after:
- earnings
- macroeconomic events
- gaps
- major news
- volatility regime changes
- structural trend breaks
Always combine channel analysis with price action, market structure,
volume, fundamentals or other confirmation tools when appropriate.
============================================================
DESIGN PHILOSOPHY
============================================================
Equalhigh Perfect Channel is based on one simple rule:
"Find the slope first. Translate it second."
The opposite side of the channel is never independently fitted.
This preserves perfect geometric parallelism and reproduces the way
high-quality manual price channels are traditionally constructed.
Equalhigh
Perfect Channel V3.1

Aviso legal
As informações e publicações não se destinam a ser, e não constituem, conselhos ou recomendações financeiras, de investimento, comerciais ou de outro tipo fornecidos ou endossados pela TradingView. Leia mais nos Termos de Uso.
Aviso legal
As informações e publicações não se destinam a ser, e não constituem, conselhos ou recomendações financeiras, de investimento, comerciais ou de outro tipo fornecidos ou endossados pela TradingView. Leia mais nos Termos de Uso.