MYND Volume Profile Value Zones v1.0
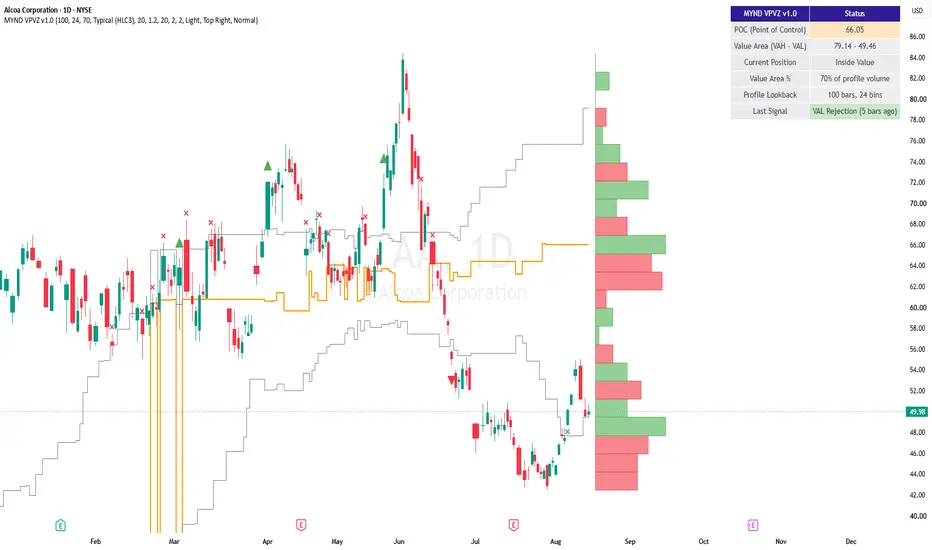
MYND Volume Profile Value Zones [v1.0]
A from-scratch rolling Volume Profile - see where volume actually traded, find the Point of Control, and watch price react to a self-updating Value Area.
WHAT IT DOES
This indicator bins the last N bars' volume by price into a live histogram, finds the Point of Control (POC - the single price level with the most traded volume), and expands a Value Area (default 70% of profile volume) outward from the POC using the same standard "expand toward the side with more incremental volume" method real volume profile tools use. Unlike session/weekly/monthly anchored profiles, this one is fully rolling: it recomputes fresh every bar from a fixed recent lookback window, so it always reflects the same amount of current trading activity rather than growing across a session.
HOW IT WORKS
Each historical bar's entire volume is assigned to one price bin, based on that bar's typical price (HLC3 by default, configurable) - a real, commonly-used technique for building efficient rolling profiles that trades a small amount of intrabar precision for a much cheaper, more robust calculation than distributing volume proportionally across every bin a bar's range touches. The POC is simply the highest-volume bin; the Value Area expands outward from it, one bin at a time toward whichever side carries more volume, until it contains your configured percentage of the total.
Signals fire on Value Area High/Low breakouts (requiring volume confirmation) and rejections (reversion back into value) - a Bounce/Break-style taxonomy shared with MYND Anchored Value Zones for a consistent feel across the suite's value-zone tools.
KEY FEATURES
A live, updating volume profile histogram drawn directly on the chart, colored by whether up-volume or down-volume dominated each price level. Plotted POC and Value Area High/Low lines that update every bar. A dashboard showing the current POC, Value Area range, whether price is currently above, below, or inside value, and the last signal fired. 4 individual alerts plus 3 combo bundles. Light/Dark theme presets plus a colorblind-safe signal color option. Full customization throughout - colors, table size/position, line widths - with tooltips on every setting that benefits from one.
HOW TO USE IT
Works out of the box with sensible defaults - no source configuration required. Scan the histogram for the widest bars (high-interest price levels that tend to act as support/resistance) and thin or gapped areas (levels price tends to move through quickly). Use the POC and Value Area lines as dynamic reference levels the way you would any support/resistance zone, and let the Bounce/Break signals flag when price is actually leaving or failing to leave the current value range.
SETTINGS WORTH TUNING FIRST
Profile Lookback (bars) - shorten to track only very recent trading activity, lengthen for a broader, more stable structural read. Number of Price Bins - more bins for finer resolution, fewer for a cleaner look. Value Area % - 70% is the standard convention, but adjustable.
WHAT THIS TOOL DELIBERATELY DOES NOT DO
POC and Value Area describe where volume already traded, not where price will go next - they're structural context, not a directional forecast. Because of that, this tool does not carry a self-tracking accuracy dashboard the way some other MYND tools do; bolting a prediction-accuracy tracker onto a structural read would be a forced fit. This is also not a session/weekly/monthly anchored profile - it's intentionally the always-current rolling-window variant.
ALERTS
All 7 alerts (4 individual breakout/rejection alerts plus 3 combo bundles) use TradingView's standard alertcondition() system - no special setup required. Add Alert -> Condition -> this script -> pick the named alert from the dropdown.
This tool is provided for informational and educational purposes and does not constitute financial advice. Trading involves risk; past performance and historical patterns do not guarantee future results.
A from-scratch rolling Volume Profile - see where volume actually traded, find the Point of Control, and watch price react to a self-updating Value Area.
WHAT IT DOES
This indicator bins the last N bars' volume by price into a live histogram, finds the Point of Control (POC - the single price level with the most traded volume), and expands a Value Area (default 70% of profile volume) outward from the POC using the same standard "expand toward the side with more incremental volume" method real volume profile tools use. Unlike session/weekly/monthly anchored profiles, this one is fully rolling: it recomputes fresh every bar from a fixed recent lookback window, so it always reflects the same amount of current trading activity rather than growing across a session.
HOW IT WORKS
Each historical bar's entire volume is assigned to one price bin, based on that bar's typical price (HLC3 by default, configurable) - a real, commonly-used technique for building efficient rolling profiles that trades a small amount of intrabar precision for a much cheaper, more robust calculation than distributing volume proportionally across every bin a bar's range touches. The POC is simply the highest-volume bin; the Value Area expands outward from it, one bin at a time toward whichever side carries more volume, until it contains your configured percentage of the total.
Signals fire on Value Area High/Low breakouts (requiring volume confirmation) and rejections (reversion back into value) - a Bounce/Break-style taxonomy shared with MYND Anchored Value Zones for a consistent feel across the suite's value-zone tools.
KEY FEATURES
A live, updating volume profile histogram drawn directly on the chart, colored by whether up-volume or down-volume dominated each price level. Plotted POC and Value Area High/Low lines that update every bar. A dashboard showing the current POC, Value Area range, whether price is currently above, below, or inside value, and the last signal fired. 4 individual alerts plus 3 combo bundles. Light/Dark theme presets plus a colorblind-safe signal color option. Full customization throughout - colors, table size/position, line widths - with tooltips on every setting that benefits from one.
HOW TO USE IT
Works out of the box with sensible defaults - no source configuration required. Scan the histogram for the widest bars (high-interest price levels that tend to act as support/resistance) and thin or gapped areas (levels price tends to move through quickly). Use the POC and Value Area lines as dynamic reference levels the way you would any support/resistance zone, and let the Bounce/Break signals flag when price is actually leaving or failing to leave the current value range.
SETTINGS WORTH TUNING FIRST
Profile Lookback (bars) - shorten to track only very recent trading activity, lengthen for a broader, more stable structural read. Number of Price Bins - more bins for finer resolution, fewer for a cleaner look. Value Area % - 70% is the standard convention, but adjustable.
WHAT THIS TOOL DELIBERATELY DOES NOT DO
POC and Value Area describe where volume already traded, not where price will go next - they're structural context, not a directional forecast. Because of that, this tool does not carry a self-tracking accuracy dashboard the way some other MYND tools do; bolting a prediction-accuracy tracker onto a structural read would be a forced fit. This is also not a session/weekly/monthly anchored profile - it's intentionally the always-current rolling-window variant.
ALERTS
All 7 alerts (4 individual breakout/rejection alerts plus 3 combo bundles) use TradingView's standard alertcondition() system - no special setup required. Add Alert -> Condition -> this script -> pick the named alert from the dropdown.
This tool is provided for informational and educational purposes and does not constitute financial advice. Trading involves risk; past performance and historical patterns do not guarantee future results.

Aviso legal
As informações e publicações não se destinam a ser, e não constituem, conselhos ou recomendações financeiras, de investimento, comerciais ou de outro tipo fornecidos ou endossados pela TradingView. Leia mais nos Termos de Uso.
Aviso legal
As informações e publicações não se destinam a ser, e não constituem, conselhos ou recomendações financeiras, de investimento, comerciais ou de outro tipo fornecidos ou endossados pela TradingView. Leia mais nos Termos de Uso.