Auction Regime Engine [v1.4 Historical Auction Spans]
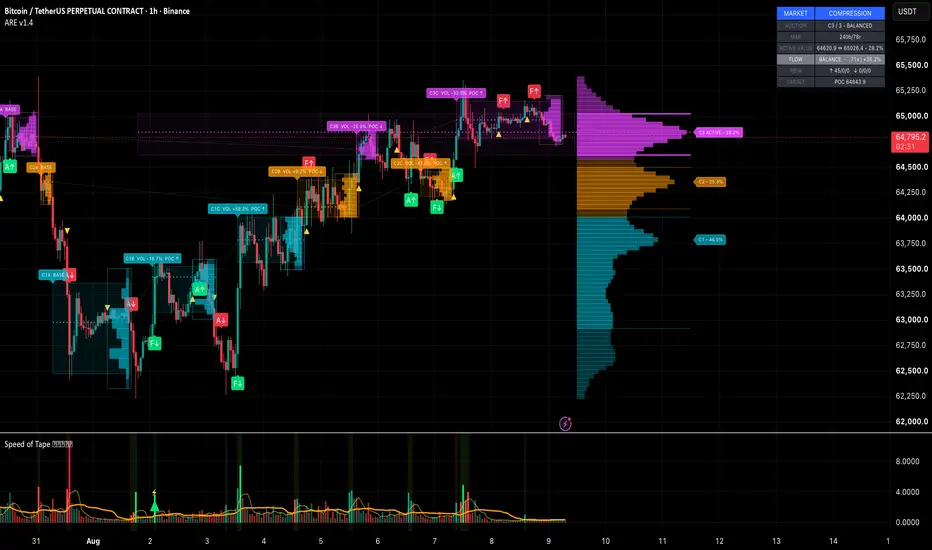
Here’s a polished TradingView-ready description in the same BBCode style you’ve used before.
Overview
Auction Regime Engine is a volume-profile and footprint-based auction analysis tool designed to visualize how value forms, migrates, compresses, expands and gets revisited over time.
The indicator combines a broad adaptive volume profile with historical auction episodes and a stateful regime engine.
Instead of asking only:
it tries to answer a more useful set of questions:
Core Concept
Traditional volume profiles aggregate volume by price, but they do not always make it easy to understand when that volume was created.
Auction Regime Engine adds a time dimension.
A broad volume concentration may contain several separate historical auctions:
Each episode is displayed separately so changes in participation and accepted value can be compared directly.
Adaptive Volume Cluster Map
The right-side profile builds a high-resolution composite volume map across a broad adaptive lookback.
The engine:
The result is a map of the major accepted-value regions currently present in the auction.
Historical Auction Spans
The indicator also searches the profile history for distinct periods where each price cluster was actively accepted.
For every significant episode it draws:
This makes repeated development in the same price region visible as separate auctions rather than combining everything into one historical box.
For example:
This means the same broad value region was revisited later, but the second auction developed approximately 18% less participation per bar while its accepted POC migrated higher.
Auction Evolution
Historical episodes belonging to the same cluster are connected with subtle dotted lines.
These connections help visualize two important changes:
This allows the historical map to show not only where value existed, but how the auction evolved each time price returned.
Current Auction Regime
The live engine evaluates the active cluster and classifies the current market environment.
Possible states include:
The goal is not to predict the next candle.
The goal is to distinguish between two very different auction outcomes:
Expansion and Acceptance Model
The live scoring engine evaluates several components together:
These are combined into Participation, Expansion and Acceptance scores.
The dashboard displays them as:
for both bullish and bearish directions.
Dashboard
The compact dashboard separates three different concepts:
It also displays:
Event Tape
Important auction transitions can also be shown directly on the candles.
Events include:
The indicator uses event priority and cooldown logic to reduce repeated signals and chart clutter.
Target Logic
When price remains inside accepted value, POC remains the natural rotational reference.
When price achieves accepted expansion outside value, the engine can instead reference the POC of the next detected volume cluster.
Conceptually:
Adaptive Mode
Adaptive Mode is enabled by default.
It automatically adjusts:
The intention is for the indicator to require minimal configuration across different timeframes.
Advanced manual overrides remain available for users who want more control.
Visual Modes
Clean
Designed for normal chart use.
Shows:
Full
Adds additional diagnostic information, including secondary events and more structural detail.
How I Use It
The indicator is intended as an auction-context tool rather than a standalone entry system.
A simple workflow is:
Important Notes
Auction Regime Engine uses TradingView's native footprint data through Pine Script.
The high-resolution current map is built directly from footprint volume rows.
For performance, the historical event state machine uses a lighter structural model between profile refreshes rather than rebuilding the entire composite footprint map on every historical bar.
Historical auction episodes are analytical reconstructions based on volume participation and should be treated as contextual structure rather than exact exchange-defined sessions.
Requirements
This script uses `request.footprint()` and therefore requires access to TradingView's Pine footprint functionality.
Disclaimer
This indicator is an analytical tool and does not provide financial advice or guarantee future price movement.
Volume, footprint, value-area and regime information should be interpreted together with market context, liquidity, risk management and execution conditions.
Overview
Auction Regime Engine is a volume-profile and footprint-based auction analysis tool designed to visualize how value forms, migrates, compresses, expands and gets revisited over time.
The indicator combines a broad adaptive volume profile with historical auction episodes and a stateful regime engine.
Instead of asking only:
“Where is the current POC / VAH / VAL?”
it tries to answer a more useful set of questions:
- Where has meaningful value formed?
- Was that value built once or revisited multiple times?
- Is participation increasing or decreasing between revisits?
- Is price currently balancing, compressing, probing, accepting or rejecting value?
- If price leaves value, is the auction migrating toward another volume cluster or rotating back toward POC?
Core Concept
Traditional volume profiles aggregate volume by price, but they do not always make it easy to understand when that volume was created.
Auction Regime Engine adds a time dimension.
A broad volume concentration may contain several separate historical auctions:
C2A — Initial value development
Price leaves the area
C2B — Later revisit and value development
Each episode is displayed separately so changes in participation and accepted value can be compared directly.
Adaptive Volume Cluster Map
The right-side profile builds a high-resolution composite volume map across a broad adaptive lookback.
The engine:
- Aggregates native TradingView footprint volume by price
- Automatically adapts the profile horizon to the chart timeframe
- Adjusts profile resolution based on market range and volatility
- Applies Gaussian smoothing to identify meaningful volume concentrations
- Detects dominant HVN-style clusters
- Uses low-volume valleys to separate neighboring distributions
- Calculates local POC, VAH and VAL for each cluster
The result is a map of the major accepted-value regions currently present in the auction.
Historical Auction Spans
The indicator also searches the profile history for distinct periods where each price cluster was actively accepted.
For every significant episode it draws:
- The full historical time span of the auction
- Episode-specific VAH and VAL
- Episode-specific POC
- A compact volume profile inside the historical span
This makes repeated development in the same price region visible as separate auctions rather than combining everything into one historical box.
For example:
C2A BASE
...
C2B VOL -18% POC ↑
This means the same broad value region was revisited later, but the second auction developed approximately 18% less participation per bar while its accepted POC migrated higher.
Auction Evolution
Historical episodes belonging to the same cluster are connected with subtle dotted lines.
These connections help visualize two important changes:
- Value migration — whether the episode POC moved higher or lower
- Participation change — whether volume intensity strengthened or weakened on the revisit
This allows the historical map to show not only where value existed, but how the auction evolved each time price returned.
Current Auction Regime
The live engine evaluates the active cluster and classifies the current market environment.
Possible states include:
BALANCE
COMPRESSION
PROBE ↑ / ↓
ACCEPTED ↑ / ↓
ROTATING ↑ / ↓
MIGRATED ↑ / ↓
The goal is not to predict the next candle.
The goal is to distinguish between two very different auction outcomes:
Price leaves value + participation expands + acceptance develops
→ potential value migration / continuation
Price tests outside value + participation fails + price returns
→ rejection / rotation toward POC
Expansion and Acceptance Model
The live scoring engine evaluates several components together:
- Relative volume
- Range expansion relative to ATR
- Footprint delta
- Percentage of current footprint volume trading outside value
- Current footprint POC migration
- Consecutive closes outside the value area
These are combined into Participation, Expansion and Acceptance scores.
The dashboard displays them as:
P / E / A
for both bullish and bearish directions.
Dashboard
The compact dashboard separates three different concepts:
- MARKET — compression / expansion environment
- AUCTION — current cluster and whether price is inside or outside accepted value
- FLOW — current state-machine transition such as rotation, probe or acceptance
It also displays:
- Active VAH / VAL
- Active cluster
- Relative volume
- Footprint delta
- Participation / Expansion / Acceptance scores
- Current auction target
Event Tape
Important auction transitions can also be shown directly on the candles.
Events include:
P↑ / P↓ — Probe
A↑ / A↓ — Accepted expansion
F↑ / F↓ — Failed break
M↑ / M↓ — Migration
R↑ / R↓ — Rejection / rotation
The indicator uses event priority and cooldown logic to reduce repeated signals and chart clutter.
Target Logic
When price remains inside accepted value, POC remains the natural rotational reference.
When price achieves accepted expansion outside value, the engine can instead reference the POC of the next detected volume cluster.
Conceptually:
Rejected breakout
→ rotate toward current POC
Accepted breakout
→ migrate toward neighboring value / next POC
Adaptive Mode
Adaptive Mode is enabled by default.
It automatically adjusts:
- Profile lookback
- Price-bin resolution
- Gaussian smoothing
- Cluster separation
- Cluster selectivity
- Historical event lookback
- Structure refresh cadence
- Compression thresholds
- Expansion / acceptance thresholds
The intention is for the indicator to require minimal configuration across different timeframes.
Advanced manual overrides remain available for users who want more control.
Visual Modes
Clean
Designed for normal chart use.
Shows:
- Current context profile
- Most important historical auction spans
- Active value structure
- Sparse event markers
- Dashboard
Full
Adds additional diagnostic information, including secondary events and more structural detail.
How I Use It
The indicator is intended as an auction-context tool rather than a standalone entry system.
A simple workflow is:
- Identify the active value cluster.
- Observe whether the market is balancing or compressing.
- Watch what happens when price reaches VAH / VAL or an LVN transition.
- Use the expansion and acceptance information to distinguish a genuine auction change from a failed excursion.
- Use footprint / execution confirmation for the actual trade trigger.
Important Notes
Auction Regime Engine uses TradingView's native footprint data through Pine Script.
The high-resolution current map is built directly from footprint volume rows.
For performance, the historical event state machine uses a lighter structural model between profile refreshes rather than rebuilding the entire composite footprint map on every historical bar.
Historical auction episodes are analytical reconstructions based on volume participation and should be treated as contextual structure rather than exact exchange-defined sessions.
Requirements
This script uses `request.footprint()` and therefore requires access to TradingView's Pine footprint functionality.
Disclaimer
This indicator is an analytical tool and does not provide financial advice or guarantee future price movement.
Volume, footprint, value-area and regime information should be interpreted together with market context, liquidity, risk management and execution conditions.

Aviso legal
As informações e publicações não se destinam a ser, e não constituem, conselhos ou recomendações financeiras, de investimento, comerciais ou de outro tipo fornecidos ou endossados pela TradingView. Leia mais nos Termos de Uso.
Aviso legal
As informações e publicações não se destinam a ser, e não constituem, conselhos ou recomendações financeiras, de investimento, comerciais ou de outro tipo fornecidos ou endossados pela TradingView. Leia mais nos Termos de Uso.