SMT Divergence Oscillator [josseliani]
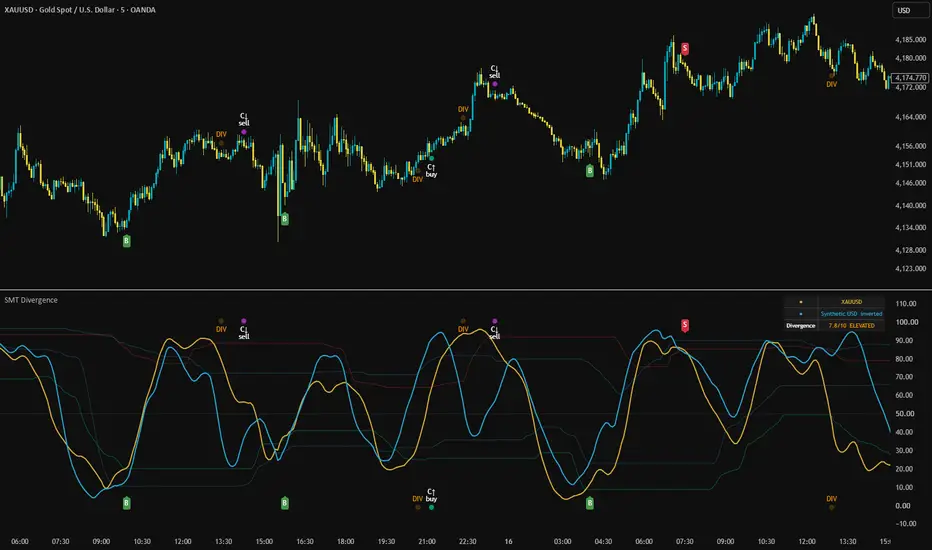
📊 SMT Divergence Oscillator — Spot when markets fall out of sync and reveal potential reversal opportunities.
Comparing correlated instruments is a well-known technical analysis method. We observe how closely two markets move together, when one begins to lead the other, and how their divergence develops over time.
The indicator displays these relationships in a separate pane without cluttering the main price chart.
📊 What Can Be Compared
For example:
• S&P 500 ↔ Dow Jones
• S&P 500 ↔ Nasdaq
• Bitcoin ↔ Ethereum
• EURUSD ↔ GBPUSD
• EURUSD ↔ Dollar Index (DXY)
• AUDUSD ↔ Dollar Index (DXY)
• Gold (XAUUSD) ↔ Dollar Index (DXY)
• Gold ↔ Silver
You can also select almost any other instruments available on TradingView.
🧩 Built-in Synthetic Dollar Index
One of the indicator's features is its built-in Synthetic USD index, calculated directly within the script using a basket of six currency pairs.
This is particularly useful when the forex market is already active but the regular DXY symbol from a selected data provider is not yet updating.
Instead of relying on a stationary DXY line, the indicator continues calculating its own dollar index from available currency quotes.
This means that comparisons between currencies, gold, and the dollar are not dependent on the trading session of a particular DXY symbol. The underlying currency quotes must still be available.
Synthetic USD is the default comparison source. Other synthetic currency indices and a Custom Symbol option are also available.
Comparison Orientation
For standard currency comparisons, the direction of the second oscillator is determined automatically.
For example, when comparing EURUSD, GBPUSD, or gold with Synthetic USD, the dollar index is inverted.
If the dollar strengthens while EURUSD declines, both oscillator lines will move in the same direction.
For USDJPY and USDCHF, the dollar index keeps its normal direction.
The orientation can also be changed manually.
🧩 How the Oscillator Works
Two lines are displayed in a separate pane:
• Yellow → Main chart instrument
• Blue → Selected comparison instrument
Both lines are normalized and smoothed, allowing instruments with different prices and volatility to be compared.
Each instrument has its own Dynamic Bands.
This is important because different markets have different movement speeds, volatility, and reversal characteristics.
For example, Bitcoin and Ethereum may move in the same direction but reach local extremes at different times.
Each oscillator therefore has its own upper and lower adaptive zones, calculated from its recent values.
The indicator monitors exits from these zones and compares the behavior of both instruments.
1️⃣ BUY / SELL — Synchronization
Regular BUY and SELL signals appear when both instruments confirm movement in the same direction.
BUY → Both oscillators exit upward from their own lower adaptive zones.
SELL → Both oscillators exit downward from their own upper adaptive zones.
The lines do not need to cross their boundaries on the same candle.
The indicator uses a confirmation window: one instrument may exit first, while the second confirms several candles later.
The default window is 5 bars and can be adjusted in Settings.
Signals appear as small green B and red S markers.
2️⃣ DIV — Strong Divergence
A separate event, DIV, is displayed as an orange circle.
DIV occurs when the distance between the two oscillators becomes statistically unusual compared with recent history.
Divergence strength is continuously displayed in the table on a scale from 1.0 to 10.0, including decimal values.
For example:
• 7.5/10 → Elevated divergence
• 9.0/10 → Extreme divergence relative to recent history
The minimum DIV threshold can be adjusted in Settings.
DIV does not provide a trade direction by itself.
When two instruments move far apart, several outcomes are possible. The first instrument may reverse, the second may catch up, or both may continue moving differently.
DIV is primarily a warning that a market relationship is worth watching.
3️⃣ CORR BUY / CORR SELL — Divergence Resolution
These signals are designed to identify potential movement in the main chart instrument after a strong divergence.
Following DIV, the indicator monitors the yellow oscillator's behavior around its adaptive boundaries.
There are two confirmation methods.
A. Gap Contraction
The yellow oscillator exits its own adaptive zone, and the distance between the instruments begins to decrease.
A minimum percentage of gap reduction can be configured in Settings.
The second oscillator does not need to confirm a zone exit for this method.
B. Synchronized Zone Exits
Both oscillators confirm movement in the same direction within the specified window.
Additional percentage contraction is not required, but the distance between the lines must not continue increasing.
The signal direction is also checked against the closing price candle of the main chart instrument.
When the conditions are met, CORR BUY or CORR SELL appears.
If a regular BUY/SELL and CORR signal are confirmed simultaneously, CORR takes priority to avoid overlapping markers.
⚙️ Main Settings
• Comparison Source — Built-in synthetic currency indices or any Custom Symbol available on TradingView.
• Comparison Orientation — Auto, Normal, or Inverted.
• Smoothing Length — Default 8. Lower values provide faster reactions but may increase noise.
• Responsiveness — Controls the sensitivity of adaptive smoothing.
• BUY/SELL Window — Maximum distance between confirming oscillator exits. Default 5 bars.
• DIV Setup Window — Window for identifying the main oscillator's zone exit relative to DIV. Default 25 bars.
• CORR Confirmation Window — Maximum waiting time for CORR confirmation. Default 25 bars.
• CORR Gap Reduction — Minimum percentage reduction required for gap-contraction confirmation.
• Minimum Divergence Strength — Minimum strength required to generate a DIV event. Default 9.0/10.
Additional display settings control the oscillator lines, adaptive boundaries, markers, and comparison table.
🔔 Alerts
Five alert conditions are available:
• SYNC BUY
• SYNC SELL
• DIV
• CORR BUY
• CORR SELL
All signals are confirmed after candle close.
Data Availability
The indicator checks whether comparison quotes are sufficiently recent relative to the main chart.
If the required data stops updating, comparison signals are temporarily suspended to avoid using outdated quotes.
💡 How I Use It — Market Examples
I use SMT Divergence Oscillator across different markets and timeframes, depending on the relationship I want to analyze.
AUDUSD vs Synthetic USD — 1H

On the hourly chart, I look for visible divergences between AUDUSD and the inverted dollar index. These differences help me identify potential turning areas and assess whether the currency pair is moving in line with broader USD behavior.
XAUUSD vs Synthetic USD — 5M
For gold, I prefer the 5-minute chart. I watch for strong separation between gold and the inverted dollar index, followed by a reaction of the gold oscillator at its adaptive bands. This helps me identify possible intraday reversal setups.
EURUSD vs Synthetic USD — BUY/SELL Signals

EURUSD represents the largest component of the dollar-index basket, so these two instruments naturally have a strong mechanical relationship.
For this comparison, I pay particular attention to regular BUY and SELL signals when both oscillators turn and leave their respective adaptive zones within the confirmation window.
ETH vs BTC — 1H

On the hourly chart, I compare Ethereum and Bitcoin to identify broader differences in their movements. When one cryptocurrency moves ahead of the other, the oscillator helps highlight the separation and possible subsequent convergence.
NASDAQ vs S&P 500 — 1M

During active US market hours, I use the 1-minute chart to observe short-term divergences between NASDAQ and the S&P 500. These comparisons can highlight moments when one index moves ahead of the other or fails to confirm its movement.
🔍 Synthetic Currency Indices
The indicator includes synthetic indices for USD, EUR, GBP, AUD, CAD, CHF, JPY, NZD, and XAU.
Synthetic USD is selected by default and uses a six-currency basket based on DXY weights. The other indices use custom weighted formulas rather than official index methodologies.
They are calculated directly from market quotes, so they can continue updating when standalone currency-index symbols are unavailable, provided the underlying quotes remain active.
I also find it interesting to compare a currency pair with its own synthetic index. For example, AUDUSD vs Synthetic AUD or EURUSD vs Synthetic EUR.
This shows how a currency pair behaves relative to the broader strength of its underlying currency. A pair may rise against USD while that currency weakens against a wider basket, creating a divergence worth watching.
⚠️ A Few Things to Remember
The indicator does not assume that every divergence must result in a reversal. Sometimes the comparison instrument catches up while the chart instrument barely moves.
I use the signals as areas for further analysis, together with price structure and market context, rather than as automatic trading instructions.
Different instruments and timeframes may require different smoothing and confirmation-window settings.
Comparing correlated instruments is a well-known technical analysis method. We observe how closely two markets move together, when one begins to lead the other, and how their divergence develops over time.
The indicator displays these relationships in a separate pane without cluttering the main price chart.
📊 What Can Be Compared
For example:
• S&P 500 ↔ Dow Jones
• S&P 500 ↔ Nasdaq
• Bitcoin ↔ Ethereum
• EURUSD ↔ GBPUSD
• EURUSD ↔ Dollar Index (DXY)
• AUDUSD ↔ Dollar Index (DXY)
• Gold (XAUUSD) ↔ Dollar Index (DXY)
• Gold ↔ Silver
You can also select almost any other instruments available on TradingView.
🧩 Built-in Synthetic Dollar Index
One of the indicator's features is its built-in Synthetic USD index, calculated directly within the script using a basket of six currency pairs.
This is particularly useful when the forex market is already active but the regular DXY symbol from a selected data provider is not yet updating.
Instead of relying on a stationary DXY line, the indicator continues calculating its own dollar index from available currency quotes.
This means that comparisons between currencies, gold, and the dollar are not dependent on the trading session of a particular DXY symbol. The underlying currency quotes must still be available.
Synthetic USD is the default comparison source. Other synthetic currency indices and a Custom Symbol option are also available.
Comparison Orientation
For standard currency comparisons, the direction of the second oscillator is determined automatically.
For example, when comparing EURUSD, GBPUSD, or gold with Synthetic USD, the dollar index is inverted.
If the dollar strengthens while EURUSD declines, both oscillator lines will move in the same direction.
For USDJPY and USDCHF, the dollar index keeps its normal direction.
The orientation can also be changed manually.
🧩 How the Oscillator Works
Two lines are displayed in a separate pane:
• Yellow → Main chart instrument
• Blue → Selected comparison instrument
Both lines are normalized and smoothed, allowing instruments with different prices and volatility to be compared.
Each instrument has its own Dynamic Bands.
This is important because different markets have different movement speeds, volatility, and reversal characteristics.
For example, Bitcoin and Ethereum may move in the same direction but reach local extremes at different times.
Each oscillator therefore has its own upper and lower adaptive zones, calculated from its recent values.
The indicator monitors exits from these zones and compares the behavior of both instruments.
1️⃣ BUY / SELL — Synchronization
Regular BUY and SELL signals appear when both instruments confirm movement in the same direction.
BUY → Both oscillators exit upward from their own lower adaptive zones.
SELL → Both oscillators exit downward from their own upper adaptive zones.
The lines do not need to cross their boundaries on the same candle.
The indicator uses a confirmation window: one instrument may exit first, while the second confirms several candles later.
The default window is 5 bars and can be adjusted in Settings.
Signals appear as small green B and red S markers.
2️⃣ DIV — Strong Divergence
A separate event, DIV, is displayed as an orange circle.
DIV occurs when the distance between the two oscillators becomes statistically unusual compared with recent history.
Divergence strength is continuously displayed in the table on a scale from 1.0 to 10.0, including decimal values.
For example:
• 7.5/10 → Elevated divergence
• 9.0/10 → Extreme divergence relative to recent history
The minimum DIV threshold can be adjusted in Settings.
DIV does not provide a trade direction by itself.
When two instruments move far apart, several outcomes are possible. The first instrument may reverse, the second may catch up, or both may continue moving differently.
DIV is primarily a warning that a market relationship is worth watching.
3️⃣ CORR BUY / CORR SELL — Divergence Resolution
These signals are designed to identify potential movement in the main chart instrument after a strong divergence.
Following DIV, the indicator monitors the yellow oscillator's behavior around its adaptive boundaries.
There are two confirmation methods.
A. Gap Contraction
The yellow oscillator exits its own adaptive zone, and the distance between the instruments begins to decrease.
A minimum percentage of gap reduction can be configured in Settings.
The second oscillator does not need to confirm a zone exit for this method.
B. Synchronized Zone Exits
Both oscillators confirm movement in the same direction within the specified window.
Additional percentage contraction is not required, but the distance between the lines must not continue increasing.
The signal direction is also checked against the closing price candle of the main chart instrument.
When the conditions are met, CORR BUY or CORR SELL appears.
If a regular BUY/SELL and CORR signal are confirmed simultaneously, CORR takes priority to avoid overlapping markers.
⚙️ Main Settings
• Comparison Source — Built-in synthetic currency indices or any Custom Symbol available on TradingView.
• Comparison Orientation — Auto, Normal, or Inverted.
• Smoothing Length — Default 8. Lower values provide faster reactions but may increase noise.
• Responsiveness — Controls the sensitivity of adaptive smoothing.
• BUY/SELL Window — Maximum distance between confirming oscillator exits. Default 5 bars.
• DIV Setup Window — Window for identifying the main oscillator's zone exit relative to DIV. Default 25 bars.
• CORR Confirmation Window — Maximum waiting time for CORR confirmation. Default 25 bars.
• CORR Gap Reduction — Minimum percentage reduction required for gap-contraction confirmation.
• Minimum Divergence Strength — Minimum strength required to generate a DIV event. Default 9.0/10.
Additional display settings control the oscillator lines, adaptive boundaries, markers, and comparison table.
🔔 Alerts
Five alert conditions are available:
• SYNC BUY
• SYNC SELL
• DIV
• CORR BUY
• CORR SELL
All signals are confirmed after candle close.
Data Availability
The indicator checks whether comparison quotes are sufficiently recent relative to the main chart.
If the required data stops updating, comparison signals are temporarily suspended to avoid using outdated quotes.
💡 How I Use It — Market Examples
I use SMT Divergence Oscillator across different markets and timeframes, depending on the relationship I want to analyze.
AUDUSD vs Synthetic USD — 1H
On the hourly chart, I look for visible divergences between AUDUSD and the inverted dollar index. These differences help me identify potential turning areas and assess whether the currency pair is moving in line with broader USD behavior.
XAUUSD vs Synthetic USD — 5M
For gold, I prefer the 5-minute chart. I watch for strong separation between gold and the inverted dollar index, followed by a reaction of the gold oscillator at its adaptive bands. This helps me identify possible intraday reversal setups.
EURUSD vs Synthetic USD — BUY/SELL Signals
EURUSD represents the largest component of the dollar-index basket, so these two instruments naturally have a strong mechanical relationship.
For this comparison, I pay particular attention to regular BUY and SELL signals when both oscillators turn and leave their respective adaptive zones within the confirmation window.
ETH vs BTC — 1H
On the hourly chart, I compare Ethereum and Bitcoin to identify broader differences in their movements. When one cryptocurrency moves ahead of the other, the oscillator helps highlight the separation and possible subsequent convergence.
NASDAQ vs S&P 500 — 1M
During active US market hours, I use the 1-minute chart to observe short-term divergences between NASDAQ and the S&P 500. These comparisons can highlight moments when one index moves ahead of the other or fails to confirm its movement.
🔍 Synthetic Currency Indices
The indicator includes synthetic indices for USD, EUR, GBP, AUD, CAD, CHF, JPY, NZD, and XAU.
Synthetic USD is selected by default and uses a six-currency basket based on DXY weights. The other indices use custom weighted formulas rather than official index methodologies.
They are calculated directly from market quotes, so they can continue updating when standalone currency-index symbols are unavailable, provided the underlying quotes remain active.
I also find it interesting to compare a currency pair with its own synthetic index. For example, AUDUSD vs Synthetic AUD or EURUSD vs Synthetic EUR.
This shows how a currency pair behaves relative to the broader strength of its underlying currency. A pair may rise against USD while that currency weakens against a wider basket, creating a divergence worth watching.
⚠️ A Few Things to Remember
The indicator does not assume that every divergence must result in a reversal. Sometimes the comparison instrument catches up while the chart instrument barely moves.
I use the signals as areas for further analysis, together with price structure and market context, rather than as automatic trading instructions.
Different instruments and timeframes may require different smoothing and confirmation-window settings.

Indicators, updates & setups:
magicdiagonals.com/
Free Telegram: t.me/magicdiagonals
magicdiagonals.com/
Free Telegram: t.me/magicdiagonals
Aviso legal
As informações e publicações não se destinam a ser, e não constituem, conselhos ou recomendações financeiras, de investimento, comerciais ou de outro tipo fornecidos ou endossados pela TradingView. Leia mais nos Termos de Uso.
Indicators, updates & setups:
magicdiagonals.com/
Free Telegram: t.me/magicdiagonals
magicdiagonals.com/
Free Telegram: t.me/magicdiagonals
Aviso legal
As informações e publicações não se destinam a ser, e não constituem, conselhos ou recomendações financeiras, de investimento, comerciais ou de outro tipo fornecidos ou endossados pela TradingView. Leia mais nos Termos de Uso.