OPEN-SOURCE SCRIPT
Atualizado MINICRORE V2.0
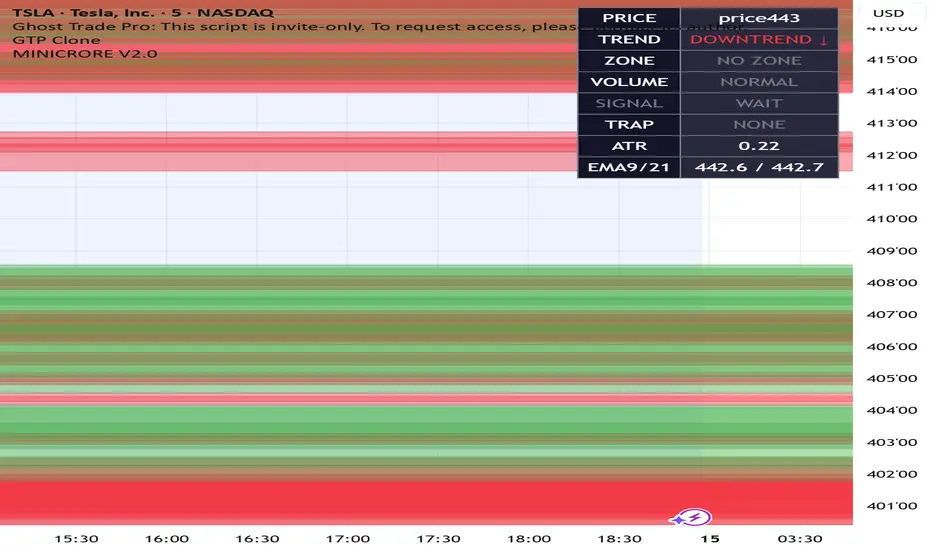
================================================================================
COMPLETE HOW-TO-USE GUIDE
ATP Pro v2 | Pine Script v6
================================================================================
ZONES: 4 Levels | SIGNALS: Buy & Sell | ALERTS: 4 Types | MTF: 1H 4H D W
================================================================================
SECTION 1 — OVERVIEW & INSTALLATION
================================================================================
WHAT IS THIS INDICATOR?
------------------------
(ATP Pro v2) is a professional-grade TradingView indicator
that replicates the . It identifies high-probability supply
and demand zones across multiple levels, detects trade traps, and provides
multi-timeframe trend analysis — all in one Pine Script v6 script.
HOW TO INSTALL ON TRADINGVIEW (8 Steps)
-----------------------------------------
1. Open TradingView.com and load any futures chart (e.g. M2K1! Russell Micro)
2. Click Pine Script Editor at the bottom of the screen
3. Click New → Blank Script — delete all existing code
4. Open the file ATP_Pro_v2_FINAL.pine and copy ALL the code
5. Paste the code into the Pine Script Editor
6. Click Save and name it: Ghost Trade Pro Clone
7. Click Add to Chart — the indicator appears immediately
8. Right-click the indicator name → Settings to customize
================================================================================
SECTION 2 — UNDERSTANDING THE 4 ZONES
================================================================================
The indicator draws 4 distinct zone types matching exactly:
┌─────────────┬───────────────┬──────────────┬──────────────────────────────┐
│ Zone Label │ Color │ Direction │ What It Means │
├─────────────┼───────────────┼──────────────┼──────────────────────────────┤
│ GHST_TRP1 │ Salmon / Red │ Supply (Sell)│ Primary swing high resistance│
│ GHST_TRP2 │ Dark Red │ Supply (Sell)│ Tighter secondary supply zone│
│ GHST_LVT │ Green │ Demand (Buy) │ Primary swing low support │
│ GHST_BE │ Teal / Cyan │ Demand (Buy) │ Break-even precise entry zone│
└─────────────┴───────────────┴──────────────┴──────────────────────────────┘
TRP1 — Primary Supply Zone (Red/Salmon)
What it is: Most recent 20-bar swing high. Price rejected here before.
What to do: When price returns → SELL. Wait for bearish candle + volume
spike inside the zone before entering short.
TRP2 — Secondary Supply Zone (Dark Red)
What it is: Tighter inner band inside TRP1. Confirmed by 40-bar swing high.
Stronger signal than TRP1 alone.
What to do: If price stalls inside TRP2, higher-confidence short entry.
Tighter stop loss possible.
GHST_LVT — Primary Demand Zone (Green)
What it is: Most recent 20-bar swing low. Price bounced from here before.
Buyers are likely to defend it again.
What to do: When price returns → BUY. Wait for bullish candle + volume
spike inside the zone before entering long.
GHST_BE — Break-Even Zone (Teal/Cyan)
What it is: Tightest inner zone inside LVT. Confirmed by 40-bar swing low.
Most precise bounce level.
What to do: Ideal for tight stop entries. Highest-confidence long entry
with minimal risk when price bounces from BE specifically.
================================================================================
SECTION 3 — DOT LINES, CHANNEL & MOVING AVERAGES
================================================================================
DOTTED CIRCLE LINES
--------------------
Horizontal dotted lines with circle markers (●) span the entire chart.
These represent key price levels extending into the future.
GREEN dotted → Supply swing high → Upper resistance, price rejects here
RED dotted → Demand swing low → Lower support, price bounces here
ORANGE dotted → Midpoint level → 50% between supply/demand, pivot point
● Circle markers appear every 10 bars along each line as visual anchors.
REGRESSION CHANNEL LINES (the diagonal blue lines)
----------------------------------------------------
Three diagonal lines form a price channel using linear regression:
Upper Line (Blue) → Regression of highs → Upper channel boundary
Middle Line (Light Blue) → Regression of close → Trend direction midline
Lower Line (Blue) → Regression of lows → Lower channel boundary
HOW TO USE:
• Price bouncing off lower channel = Buy opportunity
• Price hitting upper channel = Sell opportunity
• Price breaking outside channel = Potential trend change
MOVING AVERAGES (3 Lines)
--------------------------
┌────────────┬──────┬────────┬────────┬──────────────────────────┐
│ MA │ Type │ Length │ Color │ Purpose │
├────────────┼──────┼────────┼────────┼──────────────────────────┤
│ Fast EMA │ EMA │ 9 │ Red │ Immediate momentum │
│ Mid EMA │ EMA │ 21 │ Blue │ Short-term trend filter │
│ Slow SMA │ SMA │ 50 │ Blue │ Major trend confirmation │
└────────────┴──────┴────────┴────────┴──────────────────────────┘
GOLDEN RULE: Only BUY when Fast EMA > Mid EMA > Slow SMA (all up).
Only SELL when Fast EMA < Mid EMA < Slow SMA (all down).
================================================================================
SECTION 4 — TRADING SIGNALS
================================================================================
THE 4 SIGNAL TYPES
-------------------
┌─────────────┬────────────────────┬────────┬──────────────────────────────────┐
│ Signal │ Shape │ Color │ Trigger Condition │
├─────────────┼────────────────────┼────────┼──────────────────────────────────┤
│ BUY │ Label Up Arrow │ Green │ Demand zone + volume + uptrend │
│ SELL │ Label Down Arrow │ Red │ Supply zone + volume + downtrend │
│ BULL TRAP │ Triangle Down │ Orange │ Higher high but closes bearish │
│ BEAR TRAP │ Triangle Up │ Purple │ Lower low but closes bullish │
└─────────────┴────────────────────┴────────┴──────────────────────────────────┘
THE PERFECT BUY SETUP — Step by Step
--------------------------------------
[1] Price drops into GREEN demand zone (GHST_LVT or GHST_BE)
[2] Volume bar spikes — volume > 1.5x the 20-bar average
[3] A bullish candle closes INSIDE the demand zone
[4] All 3 MAs aligned upward: Fast EMA > Mid EMA > Slow SMA
[5] BUY label appears on the chart
[6] ENTER LONG — stop below the zone, target at TRP1 supply above
THE PERFECT SELL SETUP — Step by Step
---------------------------------------
[1] Price rallies into RED supply zone (GHST_TRP1 or GHST_TRP2)
[2] Volume bar spikes — volume > 1.5x the 20-bar average
[3] A bearish candle closes INSIDE the supply zone
[4] All 3 MAs aligned downward: Fast EMA < Mid EMA < Slow SMA
[5] SELL label appears on the chart
[6] ENTER SHORT — stop above the zone, target at LVT demand below
================================================================================
SECTION 5 — TRADE TRAPS
================================================================================
BULL TRAP (Orange Triangle Down)
-----------------------------------
What it is: Price breaks above a previous high (looks like a breakout),
then closes as a large bearish (red) candle.
Bulls are trapped long at the highs.
WHAT YOU SEE: YOUR ACTION:
• Price spikes above resistance • DO NOT buy the breakout
• Large RED candle closes below • Wait for next bearish candle + volume
• Orange triangle appears • Short the rejection at TRP1 zone
• GHST_TRP1 label fires • Target: LVT demand zone below
BEAR TRAP (Purple Triangle Up)
---------------------------------
What it is: Price breaks below a previous low (looks like a breakdown),
then closes as a large bullish (green) candle.
Bears are trapped short at the lows.
WHAT YOU SEE: YOUR ACTION:
• Price spikes below support • DO NOT short the breakdown
• Large GREEN candle closes above• Wait for next bullish candle + volume
• Purple triangle appears • Long the bounce at LVT/BE demand zone
• GHST_BE label fires • Target: TRP1 supply zone above
================================================================================
SECTION 6 — INFO PANEL & MTF TABLE
================================================================================
INFO PANEL (Top Right Corner)
-------------------------------
Real-time dashboard showing all key data in one place:
┌─────────────┬──────────────────────────────────────────────────┐
│ Row │ What It Shows │
├─────────────┼──────────────────────────────────────────────────┤
│ PRICE │ Current market price │
│ TREND │ UPTREND ↑ / DOWNTREND ↓ / RANGING ↔ │
│ ZONE │ Which zone price is in (SUPPLY / DEMAND / NONE) │
│ VOLUME │ SPIKE ↑ or NORMAL │
│ SIGNAL │ BUY ↑ / SELL ↓ / WAIT │
│ TRAP │ BULL TRAP / BEAR TRAP / NONE │
│ ATR │ Current volatility value (use for stop sizing) │
│ EMA 9/21 │ Fast and Mid EMA values │
└─────────────┴──────────────────────────────────────────────────┘
QUICK CHECK: Before any trade, panel should show:
→ TREND matches your direction
→ ZONE shows SUPPLY or DEMAND
→ VOLUME shows SPIKE
→ SIGNAL shows BUY or SELL
→ TRAP shows NONE
MTF TABLE (Middle Right — Multi-Timeframe)
-------------------------------------------
Shows trend bias across 4 timeframes simultaneously:
┌────────────┬──────────────────────────────┬──────────────────┐
│ Timeframe │ How Calculated │ Arrow Up = Buy │
├────────────┼──────────────────────────────┼──────────────────┤
│ 1H │ 50 EMA vs 200 EMA │ 50 EMA > 200 EMA │
│ 4H │ Price vs 50 EMA │ Close > 50 EMA │
│ D │ Price vs 200 SMA │ Close > 200 SMA │
│ W │ Fast MA vs Slow MA │ EMA9 > SMA50 │
└────────────┴──────────────────────────────┴──────────────────┘
BEST TRADES: All 4 arrows point same direction
4x UP ↑↑↑↑ = Strongest buy environment
4x DOWN ↓↓↓↓ = Strongest sell environment
MIXED ↑↓↑↓ = Avoid or reduce position size
================================================================================
SECTION 7 — SETTINGS REFERENCE
================================================================================
ZONE SETTINGS
--------------
TRP1 Supply Lookback default: 20 M2K11 rec: 15-20 (bars to find swing high)
TRP2 Supply Lookback default: 40 M2K11 rec: 30-40 (broader confirmation)
TRP1 Demand Lookback default: 20 M2K11 rec: 15-20 (bars to find swing low)
TRP2 Demand Lookback default: 40 M2K11 rec: 30-40 (broader confirmation)
Zone Width (ATR x) default: 0.3 M2K11 rec: 0.25-0.40 (height of boxes)
VOLUME & ATR SETTINGS
----------------------
Volume Avg Length default: 20 Tight: 20 Volatile: 10-15 (faster)
Spike Multiplier default: 1.5 Tight: 1.3 Volatile: 2.0 (only big)
ATR Length default: 14 Tight: 14 Volatile: 10 (reactive)
MOVING AVERAGE SETTINGS
------------------------
┌──────────┬─────────┬──────────────┬────────────────┬──────────────┐
│ MA │ Default │ Scalping │ Day Trading │ Swing │
│ │ │ (1-5 min) │ (15m-1H) │ (4H-D) │
├──────────┼─────────┼──────────────┼────────────────┼──────────────┤
│ Fast EMA │ 9 │ 5 │ 9 │ 20 │
│ Mid EMA │ 21 │ 13 │ 21 │ 50 │
│ Slow SMA │ 50 │ 34 │ 50 │ 200 │
└──────────┴─────────┴──────────────┴────────────────┴──────────────┘
CHANNEL SETTINGS
-----------------
Channel Length default: 50 Lower = tighter channel, Higher = smoother
================================================================================
SECTION 8 — RISK MANAGEMENT & POSITION SIZING
================================================================================
STOP LOSS RULES
----------------
• Place stop OUTSIDE the zone — beyond the edge, not at it
• BUY trades: stop below the bottom of GHST_BE (teal) zone
• SELL trades: stop above the top of GHST_TRP1 (red) zone
• Formula: stop = zone edge + 1x ATR value from panel
TAKE PROFIT RULES
------------------
• Primary target: opposite zone (buy LVT → take profit at TRP1)
• Scale out: take 50% at zone midline, let 50% run to full target
• Secondary target: regression channel upper/lower line
• Minimum Risk/Reward required: 1:1.5 (never accept less)
POSITION SIZING FOR M2K11 (Russell Micro)
------------------------------------------
Note: 1 point on M2K11 = $5. A 20-point stop = $100 risk per contract.
┌─────────────┬───────────────────┬─────────────┬─────────────┐
│ Account │ Risk Per Trade 2% │ Stop (pts) │ Contracts │
├─────────────┼───────────────────┼─────────────┼─────────────┤
│ $5,000 │ $100 │ 20 pts │ 1 contract │
│ $10,000 │ $200 │ 20 pts │ 2 contracts │
│ $25,000 │ $500 │ 20 pts │ 5 contracts │
│ $50,000 │ $1,000 │ 20 pts │ 10 contracts│
└─────────────┴───────────────────┴─────────────┴─────────────┘
RULE: Never risk more than 2% of account on any single trade.
================================================================================
SECTION 9 — PRE-TRADE CHECKLIST
================================================================================
Complete ALL items before EVERY trade. If fewer than 8/10 pass → DON'T trade.
[ ] 1. Price is at a clear supply or demand zone (TRP1, TRP2, LVT, or BE)
[ ] 2. Volume spike confirmed (Info panel shows SPIKE)
[ ] 3. Moving averages aligned with trade direction
[ ] 4. MTF table shows at least 3 of 4 arrows in trade direction
[ ] 5. No active Bull or Bear trap (panel shows NONE)
[ ] 6. Reversal candle present inside the zone
[ ] 7. Stop loss level identified (beyond zone + 1x ATR)
[ ] 8. Take profit target at opposite zone identified
[ ] 9. Risk/Reward is at least 1:1.5
[ ] 10. Position size calculated (max 2% account risk)
================================================================================
SECTION 10 — COMMON MISTAKES TO AVOID
================================================================================
┌────────────────────────────────┬──────────────────────────────────────────┐
│ MISTAKE │ CORRECT APPROACH │
├────────────────────────────────┼──────────────────────────────────────────┤
│ Trading without volume spike │ Only enter when panel shows SPIKE │
│ Buying into a Bull Trap signal │ Orange triangle = skip or short instead │
│ Ignoring the MTF table │ Need 3+ arrows in your direction │
│ Stop too tight (inside zone) │ Place stop beyond zone + 1 ATR │
│ Taking partial zone signals │ ALL 10 checklist items must pass │
│ Overtrading (forcing setups) │ Max 2-3 high quality trades per day │
│ Moving stop to BE too fast │ Move stop only after 1:1 achieved │
│ Trading against MTF trend │ Trade only with the dominant trend │
└────────────────────────────────┴──────────────────────────────────────────┘
================================================================================
QUICK REFERENCE — SIGNAL CHEAT SHEET
================================================================================
AT GREEN DEMAND ZONE (LVT or BE):
Need: Bullish candle + Volume spike + MAs up + 3+ MTF arrows up
Do: BUY | Stop: below zone | Target: TRP1 supply above
AT RED SUPPLY ZONE (TRP1 or TRP2):
Need: Bearish candle + Volume spike + MAs down + 3+ MTF arrows down
Do: SELL | Stop: above zone | Target: LVT demand below
ORANGE TRIANGLE (Bull Trap):
Do NOT buy the breakout → Look to short the rejection instead
PURPLE TRIANGLE (Bear Trap):
Do NOT short the breakdown → Look to buy the bounce instead
MTF ALL UP ↑↑↑↑: Strongest buy environment — trade full size
MTF ALL DOWN ↓↓↓↓: Strongest sell environment — trade full size
MTF MIXED ↑↓: Reduce size or skip entirely
================================================================================
THE GOLDEN RULE
ZONE + VOLUME + TREND = HIGH PROBABILITY TRADE
If any one of these three is missing — wait for a better setup.
================================================================================
ATP Pro v2 | Pine Script v6 | TradingView
================================================================================
COMPLETE HOW-TO-USE GUIDE
ATP Pro v2 | Pine Script v6
================================================================================
ZONES: 4 Levels | SIGNALS: Buy & Sell | ALERTS: 4 Types | MTF: 1H 4H D W
================================================================================
SECTION 1 — OVERVIEW & INSTALLATION
================================================================================
WHAT IS THIS INDICATOR?
------------------------
(ATP Pro v2) is a professional-grade TradingView indicator
that replicates the . It identifies high-probability supply
and demand zones across multiple levels, detects trade traps, and provides
multi-timeframe trend analysis — all in one Pine Script v6 script.
HOW TO INSTALL ON TRADINGVIEW (8 Steps)
-----------------------------------------
1. Open TradingView.com and load any futures chart (e.g. M2K1! Russell Micro)
2. Click Pine Script Editor at the bottom of the screen
3. Click New → Blank Script — delete all existing code
4. Open the file ATP_Pro_v2_FINAL.pine and copy ALL the code
5. Paste the code into the Pine Script Editor
6. Click Save and name it: Ghost Trade Pro Clone
7. Click Add to Chart — the indicator appears immediately
8. Right-click the indicator name → Settings to customize
================================================================================
SECTION 2 — UNDERSTANDING THE 4 ZONES
================================================================================
The indicator draws 4 distinct zone types matching exactly:
┌─────────────┬───────────────┬──────────────┬──────────────────────────────┐
│ Zone Label │ Color │ Direction │ What It Means │
├─────────────┼───────────────┼──────────────┼──────────────────────────────┤
│ GHST_TRP1 │ Salmon / Red │ Supply (Sell)│ Primary swing high resistance│
│ GHST_TRP2 │ Dark Red │ Supply (Sell)│ Tighter secondary supply zone│
│ GHST_LVT │ Green │ Demand (Buy) │ Primary swing low support │
│ GHST_BE │ Teal / Cyan │ Demand (Buy) │ Break-even precise entry zone│
└─────────────┴───────────────┴──────────────┴──────────────────────────────┘
TRP1 — Primary Supply Zone (Red/Salmon)
What it is: Most recent 20-bar swing high. Price rejected here before.
What to do: When price returns → SELL. Wait for bearish candle + volume
spike inside the zone before entering short.
TRP2 — Secondary Supply Zone (Dark Red)
What it is: Tighter inner band inside TRP1. Confirmed by 40-bar swing high.
Stronger signal than TRP1 alone.
What to do: If price stalls inside TRP2, higher-confidence short entry.
Tighter stop loss possible.
GHST_LVT — Primary Demand Zone (Green)
What it is: Most recent 20-bar swing low. Price bounced from here before.
Buyers are likely to defend it again.
What to do: When price returns → BUY. Wait for bullish candle + volume
spike inside the zone before entering long.
GHST_BE — Break-Even Zone (Teal/Cyan)
What it is: Tightest inner zone inside LVT. Confirmed by 40-bar swing low.
Most precise bounce level.
What to do: Ideal for tight stop entries. Highest-confidence long entry
with minimal risk when price bounces from BE specifically.
================================================================================
SECTION 3 — DOT LINES, CHANNEL & MOVING AVERAGES
================================================================================
DOTTED CIRCLE LINES
--------------------
Horizontal dotted lines with circle markers (●) span the entire chart.
These represent key price levels extending into the future.
GREEN dotted → Supply swing high → Upper resistance, price rejects here
RED dotted → Demand swing low → Lower support, price bounces here
ORANGE dotted → Midpoint level → 50% between supply/demand, pivot point
● Circle markers appear every 10 bars along each line as visual anchors.
REGRESSION CHANNEL LINES (the diagonal blue lines)
----------------------------------------------------
Three diagonal lines form a price channel using linear regression:
Upper Line (Blue) → Regression of highs → Upper channel boundary
Middle Line (Light Blue) → Regression of close → Trend direction midline
Lower Line (Blue) → Regression of lows → Lower channel boundary
HOW TO USE:
• Price bouncing off lower channel = Buy opportunity
• Price hitting upper channel = Sell opportunity
• Price breaking outside channel = Potential trend change
MOVING AVERAGES (3 Lines)
--------------------------
┌────────────┬──────┬────────┬────────┬──────────────────────────┐
│ MA │ Type │ Length │ Color │ Purpose │
├────────────┼──────┼────────┼────────┼──────────────────────────┤
│ Fast EMA │ EMA │ 9 │ Red │ Immediate momentum │
│ Mid EMA │ EMA │ 21 │ Blue │ Short-term trend filter │
│ Slow SMA │ SMA │ 50 │ Blue │ Major trend confirmation │
└────────────┴──────┴────────┴────────┴──────────────────────────┘
GOLDEN RULE: Only BUY when Fast EMA > Mid EMA > Slow SMA (all up).
Only SELL when Fast EMA < Mid EMA < Slow SMA (all down).
================================================================================
SECTION 4 — TRADING SIGNALS
================================================================================
THE 4 SIGNAL TYPES
-------------------
┌─────────────┬────────────────────┬────────┬──────────────────────────────────┐
│ Signal │ Shape │ Color │ Trigger Condition │
├─────────────┼────────────────────┼────────┼──────────────────────────────────┤
│ BUY │ Label Up Arrow │ Green │ Demand zone + volume + uptrend │
│ SELL │ Label Down Arrow │ Red │ Supply zone + volume + downtrend │
│ BULL TRAP │ Triangle Down │ Orange │ Higher high but closes bearish │
│ BEAR TRAP │ Triangle Up │ Purple │ Lower low but closes bullish │
└─────────────┴────────────────────┴────────┴──────────────────────────────────┘
THE PERFECT BUY SETUP — Step by Step
--------------------------------------
[1] Price drops into GREEN demand zone (GHST_LVT or GHST_BE)
[2] Volume bar spikes — volume > 1.5x the 20-bar average
[3] A bullish candle closes INSIDE the demand zone
[4] All 3 MAs aligned upward: Fast EMA > Mid EMA > Slow SMA
[5] BUY label appears on the chart
[6] ENTER LONG — stop below the zone, target at TRP1 supply above
THE PERFECT SELL SETUP — Step by Step
---------------------------------------
[1] Price rallies into RED supply zone (GHST_TRP1 or GHST_TRP2)
[2] Volume bar spikes — volume > 1.5x the 20-bar average
[3] A bearish candle closes INSIDE the supply zone
[4] All 3 MAs aligned downward: Fast EMA < Mid EMA < Slow SMA
[5] SELL label appears on the chart
[6] ENTER SHORT — stop above the zone, target at LVT demand below
================================================================================
SECTION 5 — TRADE TRAPS
================================================================================
BULL TRAP (Orange Triangle Down)
-----------------------------------
What it is: Price breaks above a previous high (looks like a breakout),
then closes as a large bearish (red) candle.
Bulls are trapped long at the highs.
WHAT YOU SEE: YOUR ACTION:
• Price spikes above resistance • DO NOT buy the breakout
• Large RED candle closes below • Wait for next bearish candle + volume
• Orange triangle appears • Short the rejection at TRP1 zone
• GHST_TRP1 label fires • Target: LVT demand zone below
BEAR TRAP (Purple Triangle Up)
---------------------------------
What it is: Price breaks below a previous low (looks like a breakdown),
then closes as a large bullish (green) candle.
Bears are trapped short at the lows.
WHAT YOU SEE: YOUR ACTION:
• Price spikes below support • DO NOT short the breakdown
• Large GREEN candle closes above• Wait for next bullish candle + volume
• Purple triangle appears • Long the bounce at LVT/BE demand zone
• GHST_BE label fires • Target: TRP1 supply zone above
================================================================================
SECTION 6 — INFO PANEL & MTF TABLE
================================================================================
INFO PANEL (Top Right Corner)
-------------------------------
Real-time dashboard showing all key data in one place:
┌─────────────┬──────────────────────────────────────────────────┐
│ Row │ What It Shows │
├─────────────┼──────────────────────────────────────────────────┤
│ PRICE │ Current market price │
│ TREND │ UPTREND ↑ / DOWNTREND ↓ / RANGING ↔ │
│ ZONE │ Which zone price is in (SUPPLY / DEMAND / NONE) │
│ VOLUME │ SPIKE ↑ or NORMAL │
│ SIGNAL │ BUY ↑ / SELL ↓ / WAIT │
│ TRAP │ BULL TRAP / BEAR TRAP / NONE │
│ ATR │ Current volatility value (use for stop sizing) │
│ EMA 9/21 │ Fast and Mid EMA values │
└─────────────┴──────────────────────────────────────────────────┘
QUICK CHECK: Before any trade, panel should show:
→ TREND matches your direction
→ ZONE shows SUPPLY or DEMAND
→ VOLUME shows SPIKE
→ SIGNAL shows BUY or SELL
→ TRAP shows NONE
MTF TABLE (Middle Right — Multi-Timeframe)
-------------------------------------------
Shows trend bias across 4 timeframes simultaneously:
┌────────────┬──────────────────────────────┬──────────────────┐
│ Timeframe │ How Calculated │ Arrow Up = Buy │
├────────────┼──────────────────────────────┼──────────────────┤
│ 1H │ 50 EMA vs 200 EMA │ 50 EMA > 200 EMA │
│ 4H │ Price vs 50 EMA │ Close > 50 EMA │
│ D │ Price vs 200 SMA │ Close > 200 SMA │
│ W │ Fast MA vs Slow MA │ EMA9 > SMA50 │
└────────────┴──────────────────────────────┴──────────────────┘
BEST TRADES: All 4 arrows point same direction
4x UP ↑↑↑↑ = Strongest buy environment
4x DOWN ↓↓↓↓ = Strongest sell environment
MIXED ↑↓↑↓ = Avoid or reduce position size
================================================================================
SECTION 7 — SETTINGS REFERENCE
================================================================================
ZONE SETTINGS
--------------
TRP1 Supply Lookback default: 20 M2K11 rec: 15-20 (bars to find swing high)
TRP2 Supply Lookback default: 40 M2K11 rec: 30-40 (broader confirmation)
TRP1 Demand Lookback default: 20 M2K11 rec: 15-20 (bars to find swing low)
TRP2 Demand Lookback default: 40 M2K11 rec: 30-40 (broader confirmation)
Zone Width (ATR x) default: 0.3 M2K11 rec: 0.25-0.40 (height of boxes)
VOLUME & ATR SETTINGS
----------------------
Volume Avg Length default: 20 Tight: 20 Volatile: 10-15 (faster)
Spike Multiplier default: 1.5 Tight: 1.3 Volatile: 2.0 (only big)
ATR Length default: 14 Tight: 14 Volatile: 10 (reactive)
MOVING AVERAGE SETTINGS
------------------------
┌──────────┬─────────┬──────────────┬────────────────┬──────────────┐
│ MA │ Default │ Scalping │ Day Trading │ Swing │
│ │ │ (1-5 min) │ (15m-1H) │ (4H-D) │
├──────────┼─────────┼──────────────┼────────────────┼──────────────┤
│ Fast EMA │ 9 │ 5 │ 9 │ 20 │
│ Mid EMA │ 21 │ 13 │ 21 │ 50 │
│ Slow SMA │ 50 │ 34 │ 50 │ 200 │
└──────────┴─────────┴──────────────┴────────────────┴──────────────┘
CHANNEL SETTINGS
-----------------
Channel Length default: 50 Lower = tighter channel, Higher = smoother
================================================================================
SECTION 8 — RISK MANAGEMENT & POSITION SIZING
================================================================================
STOP LOSS RULES
----------------
• Place stop OUTSIDE the zone — beyond the edge, not at it
• BUY trades: stop below the bottom of GHST_BE (teal) zone
• SELL trades: stop above the top of GHST_TRP1 (red) zone
• Formula: stop = zone edge + 1x ATR value from panel
TAKE PROFIT RULES
------------------
• Primary target: opposite zone (buy LVT → take profit at TRP1)
• Scale out: take 50% at zone midline, let 50% run to full target
• Secondary target: regression channel upper/lower line
• Minimum Risk/Reward required: 1:1.5 (never accept less)
POSITION SIZING FOR M2K11 (Russell Micro)
------------------------------------------
Note: 1 point on M2K11 = $5. A 20-point stop = $100 risk per contract.
┌─────────────┬───────────────────┬─────────────┬─────────────┐
│ Account │ Risk Per Trade 2% │ Stop (pts) │ Contracts │
├─────────────┼───────────────────┼─────────────┼─────────────┤
│ $5,000 │ $100 │ 20 pts │ 1 contract │
│ $10,000 │ $200 │ 20 pts │ 2 contracts │
│ $25,000 │ $500 │ 20 pts │ 5 contracts │
│ $50,000 │ $1,000 │ 20 pts │ 10 contracts│
└─────────────┴───────────────────┴─────────────┴─────────────┘
RULE: Never risk more than 2% of account on any single trade.
================================================================================
SECTION 9 — PRE-TRADE CHECKLIST
================================================================================
Complete ALL items before EVERY trade. If fewer than 8/10 pass → DON'T trade.
[ ] 1. Price is at a clear supply or demand zone (TRP1, TRP2, LVT, or BE)
[ ] 2. Volume spike confirmed (Info panel shows SPIKE)
[ ] 3. Moving averages aligned with trade direction
[ ] 4. MTF table shows at least 3 of 4 arrows in trade direction
[ ] 5. No active Bull or Bear trap (panel shows NONE)
[ ] 6. Reversal candle present inside the zone
[ ] 7. Stop loss level identified (beyond zone + 1x ATR)
[ ] 8. Take profit target at opposite zone identified
[ ] 9. Risk/Reward is at least 1:1.5
[ ] 10. Position size calculated (max 2% account risk)
================================================================================
SECTION 10 — COMMON MISTAKES TO AVOID
================================================================================
┌────────────────────────────────┬──────────────────────────────────────────┐
│ MISTAKE │ CORRECT APPROACH │
├────────────────────────────────┼──────────────────────────────────────────┤
│ Trading without volume spike │ Only enter when panel shows SPIKE │
│ Buying into a Bull Trap signal │ Orange triangle = skip or short instead │
│ Ignoring the MTF table │ Need 3+ arrows in your direction │
│ Stop too tight (inside zone) │ Place stop beyond zone + 1 ATR │
│ Taking partial zone signals │ ALL 10 checklist items must pass │
│ Overtrading (forcing setups) │ Max 2-3 high quality trades per day │
│ Moving stop to BE too fast │ Move stop only after 1:1 achieved │
│ Trading against MTF trend │ Trade only with the dominant trend │
└────────────────────────────────┴──────────────────────────────────────────┘
================================================================================
QUICK REFERENCE — SIGNAL CHEAT SHEET
================================================================================
AT GREEN DEMAND ZONE (LVT or BE):
Need: Bullish candle + Volume spike + MAs up + 3+ MTF arrows up
Do: BUY | Stop: below zone | Target: TRP1 supply above
AT RED SUPPLY ZONE (TRP1 or TRP2):
Need: Bearish candle + Volume spike + MAs down + 3+ MTF arrows down
Do: SELL | Stop: above zone | Target: LVT demand below
ORANGE TRIANGLE (Bull Trap):
Do NOT buy the breakout → Look to short the rejection instead
PURPLE TRIANGLE (Bear Trap):
Do NOT short the breakdown → Look to buy the bounce instead
MTF ALL UP ↑↑↑↑: Strongest buy environment — trade full size
MTF ALL DOWN ↓↓↓↓: Strongest sell environment — trade full size
MTF MIXED ↑↓: Reduce size or skip entirely
================================================================================
THE GOLDEN RULE
ZONE + VOLUME + TREND = HIGH PROBABILITY TRADE
If any one of these three is missing — wait for a better setup.
================================================================================
ATP Pro v2 | Pine Script v6 | TradingView
================================================================================
Notas de Lançamento
MINICRORE V2.0Script de código aberto
Em verdadeiro espírito do TradingView, o criador deste script o tornou de código aberto, para que os traders possam revisar e verificar sua funcionalidade. Parabéns ao autor! Embora você possa usá-lo gratuitamente, lembre-se de que a republicação do código está sujeita às nossas Regras da Casa.

Aviso legal
As informações e publicações não se destinam a ser, e não constituem, conselhos ou recomendações financeiras, de investimento, comerciais ou de outro tipo fornecidos ou endossados pela TradingView. Leia mais nos Termos de Uso.
Script de código aberto
Em verdadeiro espírito do TradingView, o criador deste script o tornou de código aberto, para que os traders possam revisar e verificar sua funcionalidade. Parabéns ao autor! Embora você possa usá-lo gratuitamente, lembre-se de que a republicação do código está sujeita às nossas Regras da Casa.
Aviso legal
As informações e publicações não se destinam a ser, e não constituem, conselhos ou recomendações financeiras, de investimento, comerciais ou de outro tipo fornecidos ou endossados pela TradingView. Leia mais nos Termos de Uso.