OPEN-SOURCE SCRIPT
Global Liquidity Index (Z-Score)
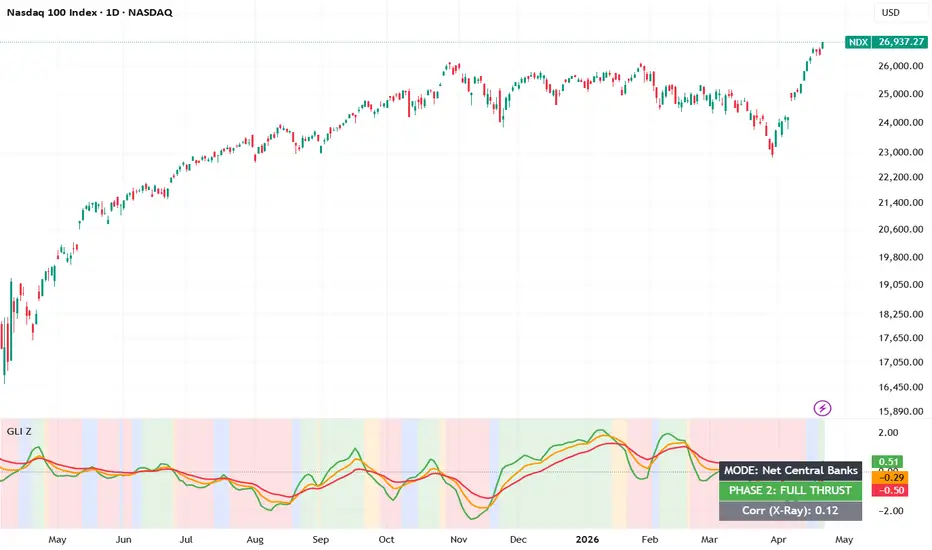
Global Liquidity Index (Quant Normalized Edition)
Overview
The Global Liquidity Index (Quant Normalized Edition) is a professional-grade macro indicator designed to track the "lifeblood" of financial markets: Fiat Liquidity. Unlike retail-focused momentum oscillators, this tool dives deep into the Market Plumbing of the world’s major central banks to provide a lead-lag perspective on asset prices.
The Core Logic
Liquidity is not a single number; it is a flow. This indicator aggregates data from the Federal Reserve (FED), ECB, PBoC, BoJ, BoE, and SNB.
It offers two distinct calculation modes:
-Net Central Banks: Focuses on the "true" spendable liquidity by calculating: (Balance Sheet - RRP - TGA) for the US, plus major global central bank assets.
-Global M2: Tracks the broad money supply growth across the world's largest economies.
Key Features
-Z-Score Normalization Layer: The breakthrough feature of this version. By applying a Z-score normalization to the liquidity Rate of Change (ROC), the script standardizes the different magnitudes of central bank balance sheets. This ensures that a massive move in the PBoC is weighted correctly against the FED, providing a balanced signal.
-4-Phase Liquidity Engine: The indicator categorizes the market regime into four distinct stages:
Phase 1: IGNITION (Blue) – Liquidity is beginning to accelerate, often preceding a major breakout.
Phase 2: FULL THRUST (Green) – Maximum liquidity momentum; the "Golden Window" for trend-following.
Phase 3: ROTATION (Orange) – Liquidity is decelerating. Momentum is fading, suggesting risk-off or distribution.
Phase 4: DROUGHT (Red) – Net liquidity is contracting.Historically associated with increased volatility and "rug pulls".
-X-Ray Projection (Offset): Includes a time-shifting engine that allows users to project the liquidity signal forward (or backward) to identify lead-lag correlations with price action.
-Dynamic Correlation: An integrated dashboard shows the real-time correlation between the liquidity flow and the current chart's price action.
How to Use
-Bullish Environments: Look for Phase 1 (Ignition) transitions into Phase 2 (Full Thrust).
-Risk Mitigation: Be cautious when the signal enters Phase 3 (Rotation), as this often marks the "topping out" of the liquidity cycle.
-Divergence: Watch for "Price vs. Liquidity" divergences, where price moves higher while liquidity (GLI) is making lower highs.
Credits & Disclaimer
Credits: The foundational macro-data fetching logic was inspired by the original work of QuantitativeAlpha. This version has been deeply modified and independently developed to include a proprietary Z-Score normalization layer, a time-shifting engine, and a 4-phase algorithmic regime filter.
Disclaimer: This indicator is for educational and informational purposes only. It does not constitute financial or investment advice.
Script de código aberto
Em verdadeiro espírito do TradingView, o criador deste script o tornou de código aberto, para que os traders possam revisar e verificar sua funcionalidade. Parabéns ao autor! Embora você possa usá-lo gratuitamente, lembre-se de que a republicação do código está sujeita às nossas Regras da Casa.

Aviso legal
As informações e publicações não se destinam a ser, e não constituem, conselhos ou recomendações financeiras, de investimento, comerciais ou de outro tipo fornecidos ou endossados pela TradingView. Leia mais nos Termos de Uso.
Script de código aberto
Em verdadeiro espírito do TradingView, o criador deste script o tornou de código aberto, para que os traders possam revisar e verificar sua funcionalidade. Parabéns ao autor! Embora você possa usá-lo gratuitamente, lembre-se de que a republicação do código está sujeita às nossas Regras da Casa.
Aviso legal
As informações e publicações não se destinam a ser, e não constituem, conselhos ou recomendações financeiras, de investimento, comerciais ou de outro tipo fornecidos ou endossados pela TradingView. Leia mais nos Termos de Uso.