OPEN-SOURCE SCRIPT
Atualizado Adaptive Dual-Engine Strategy - Momentum + Mean Reversion [BT]
Adaptive Dual-Engine Strategy - Momentum and Mean Reversion [Backtest]
Overview
Leave the entry mode on "Auto (by timeframe)" and the strategy self-selects the engine. No EMA lines are plotted - use the companion indicators for that.
How to use
Entry modes
How the Auto switch decides
How trades trigger - momentum engine (above 15-min)
How trades trigger - mean-reversion engine (15-min and below)
Risk and exit logic (shared)
Robustness on intraday charts
Timeframe guidance
Cost note
Win rate vs profit
Inputs you can tune
Reading the Strategy Tester
Notes / disclaimer
An executable backtesting strategy that contains two trading engines plus an automatic switch that picks the right one for the chart timeframe. For educational and research purposes only.
Overview
- EMA MACD momentum - trend and momentum scoring (EMA stack, MACD, RSI, ADX/DMI, volume, optional higher-timeframe trend). Intended for trending stocks and daily charts.
- Mean Reversion - fades over-extended moves back toward a moving-average mean. Intended for choppy index ETFs (SPY/QQQ) and low intraday charts.
Leave the entry mode on "Auto (by timeframe)" and the strategy self-selects the engine. No EMA lines are plotted - use the companion indicators for that.
How to use
- Add the script to a chart, then open Settings and (after any update) use Defaults > Reset settings so the current defaults apply.
- Open the Strategy Tester tab to view results.
- Change ticker or timeframe and results update automatically. On Auto, the engine changes with the timeframe - no manual switching.
Entry modes
- Auto (by timeframe) (default) - Mean Reversion on charts 15-min and below, EMA-MACD momentum above 15-min.
- EMA MACD Only - momentum: enter when the EMA-MACD score hits Strong.
- Both Agree - enter only when both momentum scores hit Strong (most selective).
- Either Signal - enter when either momentum score hits Strong (more trades).
- BuySell Only - use only the oscillator score.
- Mean Reversion - force the mean-reversion engine on any timeframe.
How the Auto switch decides
The strategy reads the chart timeframe live and selects the engine, so you do not change any setting when you switch charts. 1 to 15-minute charts use Mean Reversion; 30-minute, 1-hour and daily use EMA-MACD momentum. It only auto-switches while Entry Mode shows "Auto (by timeframe)".
How trades trigger - momentum engine (above 15-min)
- Entry needs the score to reach the Strong threshold and pass quality gates: trend alignment (longs above the 200-EMA and higher-timeframe trend), an ADX chop filter, a no-chase filter (not over-extended from the fast EMA) and an RSI guard.
- EMA MACD score range -10 to +10, Strong at +/-5. BuySell score range -12 to +12, Strong at +/-6.
- Stop-loss is ATR-based; take-profit is a configurable fraction of the stop distance.
How trades trigger - mean-reversion engine (15-min and below)
- Buy (dip): price stretches below the mean EMA by the ATR threshold while a short-period RSI is oversold and the regime allows longs; target is a return to the moving mean.
- Short (rip): price stretches above the mean EMA by the ATR threshold while the short RSI is overbought and the regime allows shorts; target is a return to the moving mean.
- Defaults: mean EMA 40, RSI(2) below 15 for buys, 0.5x ATR stretch, 2.0x ATR stop, target tracks the mean, plus a short time cap.
Risk and exit logic (shared)
- ATR-based stop and target
- Bar-count time-stop for short-term holding (on a daily chart 5 bars is about one week; intraday mean-reversion is automatically given more room)
- Position sizing default 25% of equity
- Long-only by default; an optional short toggle with a 200-EMA regime filter
- Optional scale-out, breakeven and ATR trailing for the momentum engine (off by default)
- Optional exit on an opposite signal or a neutral score (skipped automatically in Mean Reversion mode)
Robustness on intraday charts
The score is a sum of conditions; if any input is empty (for example volume on symbols that have none, or a daily higher-timeframe value that cannot resolve intraday) the whole score could become empty and produce no trades. Every score input and the trend-alignment gate are na-safe, so the strategy populates on intraday and on volume-less symbols. If a backtest is still empty, lower the entry score threshold or turn off the ADX / 200-EMA filters and allow warm-up bars.
Timeframe guidance
- Lower intraday (5 to 10-min) and the daily chart are the intended timeframes.
- 30-minute and 1-hour are not recommended for this strategy.
- No single parameter set is optimal across all timeframes - each timeframe should be validated on its own.
Cost note
Intraday targets are small, so commission and slippage matter a lot. The script ships configured for a commission-free broker; set commission and slippage in the Properties tab to match your own broker. If you pay per-trade fees, intraday is generally not suitable - use the daily chart instead.
Win rate vs profit
A tighter profit target raises the share of winning trades but can reduce overall profitability, because rare stop-losses are larger than the many small wins. Evaluate the strategy by profit factor and net result, not by win rate alone.
Inputs you can tune
- Entry mode and score thresholds
- ATR stop multiplier and reward/risk target (momentum)
- Mean-reversion EMA length, RSI level, stretch and stop
- Max hold bars (time-stop) and the trend / ADX / no-chase filters
- Position sizing, commission and slippage (Properties tab)
Reading the Strategy Tester
Overview shows win rate, profit factor (above 1.0 = profitable), net profit, max drawdown and total trades. Performance Summary breaks out long vs short. List of Trades shows every entry and exit. Judge intraday by profit factor, not win rate.
Notes / disclaimer
This is a backtesting and educational tool, not financial advice and not a guarantee of future results. Backtest results do not guarantee future performance. Always set commission and slippage to match your broker and validate on your own symbol and timeframe before any live use.
Notas de Lançamento
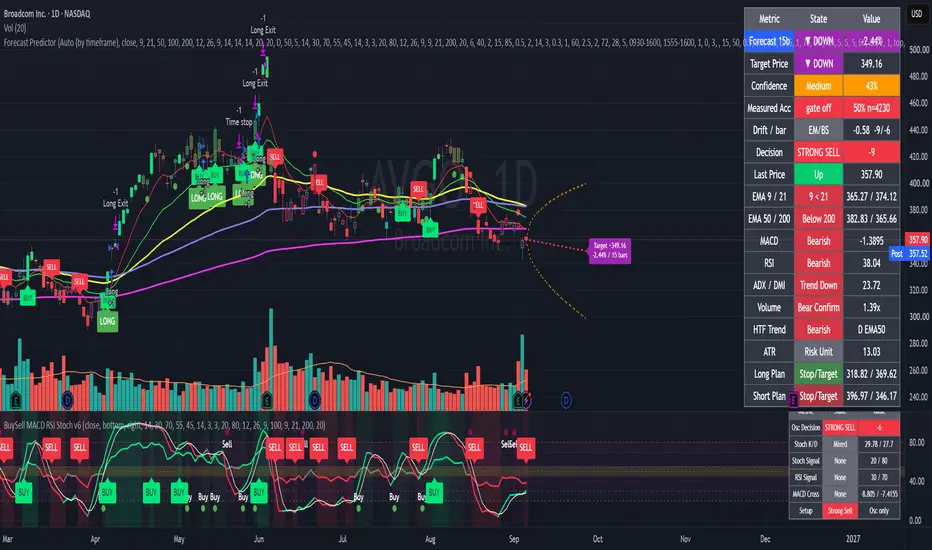
EMA MACD Forecast Predictor - Dual Engine [Backtest + Forecast]One script that does three jobs: a backtesting strategy, a forward forecast of the next N candles, and an on-chart decision panel. You no longer need to load separate indicators. For educational and research purposes only.
Overview
- Backtest: the validated Adaptive Dual-Engine strategy (EMA-MACD momentum + BuySell oscillator + mean reversion) with an automatic engine switch by timeframe.
- Forecast: a multi-model projection of the next N candles (default 15, range 5-50) with a confidence cone, a target label, and a measured-accuracy read-out.
- Decision panel: the EMA lines plus a per-indicator decision table, merged into one combined table on the chart.
Important
- A forecast is a probabilistic projection of current conditions, not a guarantee. It cannot see news, gaps, or regime changes. Use it as a directional bias and a target zone, sized by the cone.
How to use
- Add the script to a chart, then open Settings and (after any update) use Defaults then Reset settings so the current defaults apply.
- Scroll to the right edge so there is empty space after the last candle - the forecast draws into that gap.
- Open the Strategy Tester tab to view backtest results.
- The forecast updates live and appears immediately on load; on a closed market it renders once and stays static until price moves.
What you see
- Dashed curve and synthetic candles to the right of the last bar: the projected price path.
- Orange dotted cone around the path: the uncertainty band, half-width = ATR x sqrt(bar number).
- Target label at the end: target price and expected percent move over N bars.
- Combined table (top-right, movable): forecast rows plus optional decision-panel rows.
- EMA 9/21/50/100/200 lines, each with its own color and on/off toggle.
- BUY/SELL labels on candles: decision-score signals. LONG/SHORT marks: actual backtest trades.
The forecast engine
- Drift per bar = weighted blend of (1) linear-regression slope, (2) dual-engine score bias, (3) momentum/ROC. Weights are adjustable.
- About 50 bars drive the path; the score bias adds up to about 200 bars of trend context.
- Confidence cone half-width grows with the square root of the horizon, like a random-walk standard error.
Confidence vs Measured Accuracy
- Confidence percent is a live heuristic: 40% score agreement + 30% ADX trend strength + 30% regression R-squared. High = models agree and price is trending; low = chop.
- Measured Acc is the real hit-rate: every past projection is graded against what price actually did N bars later, shown with its sample size. Judge the forecast by this number, not by Confidence.
Confidence gate (optional)
- Off by default - the forecast always shows.
- Turn it on to hide the projection (and mute the forecast alert) when confidence is below your threshold (default 70).
- Measured Acc is scored on the gated subset, so you can confirm whether acting only above the threshold actually improves the hit-rate on that symbol. Watch the sample size.
Signals vs trades
- BUY/SELL labels fire on every Strong decision-score cross, regardless of filters (matches the standalone Decision Table).
- LONG/SHORT marks are actual trades, gated by trend alignment, ADX, no-chase, and RSI limits - so there are fewer of them. This difference is expected.
Backtest engine (unchanged from the Dual-Engine strategy)
- Auto (by timeframe): Mean Reversion on charts 15-min and below, EMA-MACD momentum above 15-min. You can also force a single mode.
- EMA MACD score range -10 to +10, Strong at plus or minus 5. BuySell score range -12 to +12, Strong at plus or minus 6.
- ATR-based stop and target, a bar-count time-stop, optional scale-out/breakeven/ATR trailing, and quality gates (trend alignment, ADX chop filter, no-chase, RSI guard).
- Long-only by default; optional short toggle with a 200-EMA regime filter.
New: session filters, risk sizing, automation, and a live dashboard (v6.1)
- All optional and default off (except the dashboard), so the validated backtest is unchanged until you switch one on.
- Session and date filters: limit entries to a date range, an intraday session window, and chosen weekdays; an optional session-end flatten closes positions so you do not hold overnight.
- Risk-based sizing: size each trade by a percent of equity risked to the ATR stop instead of the fixed 25% of equity, so every trade carries the same dollar risk.
- Daily circuit breaker: cap trades per day and set a max daily loss that stops new entries and flattens for the rest of the day.
- Webhook automation: emit machine-readable JSON alerts on entry and exit (action, symbol, side, price, stop, target, qty, time) for a bot or broker. Create an alert with "Any alert() function call" and leave the message box blank.
- Performance rows: live strategy stats (net profit, profit factor, win rate, W/L count, average win/loss, max drawdown, open P&L, position, trades today, day P&L, circuit-breaker status) shown in the same one combined table on the right - no second overlapping table.
Robustness
- Every score input and the forecast drift are na-safe, so the script populates on intraday charts and on volume-less symbols.
- If a backtest is empty, lower the entry score threshold or turn off the ADX / 200-EMA filters and allow warm-up bars.
Timeframe and cost notes
- Lower intraday (5 to 10-min) and the daily chart are the intended timeframes; 30-minute and 1-hour are not recommended.
- No single parameter set is optimal across all timeframes; validate each timeframe on its own.
- Intraday targets are small, so set commission and slippage in the Properties tab to match your broker, and forward-test on paper before trading real size.
Script de código aberto
Em verdadeiro espírito do TradingView, o criador deste script o tornou de código aberto, para que os traders possam revisar e verificar sua funcionalidade. Parabéns ao autor! Embora você possa usá-lo gratuitamente, lembre-se de que a republicação do código está sujeita às nossas Regras da Casa.

Aviso legal
As informações e publicações não se destinam a ser, e não constituem, conselhos ou recomendações financeiras, de investimento, comerciais ou de outro tipo fornecidos ou endossados pela TradingView. Leia mais nos Termos de Uso.
Script de código aberto
Em verdadeiro espírito do TradingView, o criador deste script o tornou de código aberto, para que os traders possam revisar e verificar sua funcionalidade. Parabéns ao autor! Embora você possa usá-lo gratuitamente, lembre-se de que a republicação do código está sujeita às nossas Regras da Casa.
Aviso legal
As informações e publicações não se destinam a ser, e não constituem, conselhos ou recomendações financeiras, de investimento, comerciais ou de outro tipo fornecidos ou endossados pela TradingView. Leia mais nos Termos de Uso.