Hawkes Vol-Expansion Detector [UFVG]
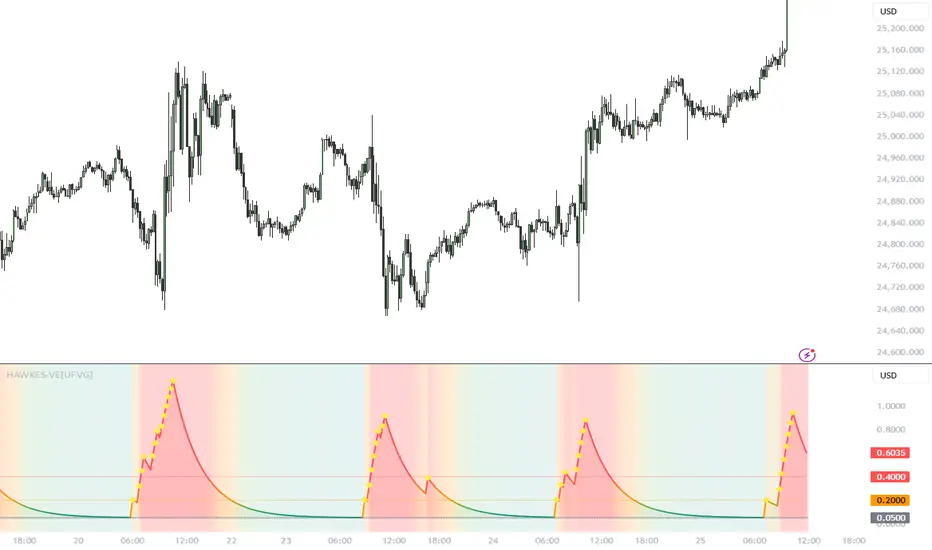
Financial markets exhibit "volatility clustering" large moves tend to be followed by large moves, and quiet periods by quiet periods. The Hawkes Vol-Expansion Detector is built on the premise that market volume and volatility are self-exciting. When a significant market shock occurs, it temporarily increases the probability of further shocks before eventually decaying back to a baseline level.
By tracking volume anomalies and ATR expansions through a mathematical framework known as a Hawkes Process, this indicator visualizes the buildup and decay of market intensity, giving traders a heads-up before prolonged volatility expansions.
The Mathematics: How It Works
At the core of this indicator is a discretized version of the Hawkes Process. It calculates the current market intensity (λ) at time t based on a constant baseline, the decayed intensity from previous periods, and new market shocks.
The exact formula calculated under the hood is:
λ_t = μ + (λ_{t-1} - μ) * e^(-β) + α * X_t
Here is what these variables represent in the indicator:
λ_t (Current Intensity): The total plotted excitation level of the market.
μ (Baseline Intensity, mu_eff): The constant, underlying rate of market activity when no shocks are occurring.
α (Excitation Jump, alpha_eff): The exact amount the intensity spikes when a new volume shock is detected.
β (Decay Rate, beta_eff): The speed at which the excess market excitement fades back to the baseline.
X_t (Shock Event): A boolean value (1 or 0) indicating if a volume/price shock occurred on the current candle.
Additionally, the indicator utilizes the Branching Ratio (n), defined mathematically as:
n = α / β
In quantitative modeling, if n < 1, the process is stable (shocks eventually die out). If n >= 1, the process becomes unstable and explodes. The auto-tuned parameters in this script are specifically designed to keep the branching ratio stable while remaining highly responsive to expansions.
Volume Shock Detection (X_t)
The indicator does not just fire the excitation parameter (α) on every candle. A "Shock Event" (X_t = 1) strictly occurs only when both of the following conditions are met:
Volume Z-Score: The current volume must exceed its rolling moving average by a specific standard deviation threshold.
Z = (V_t - μ_V) / σ_V
ATR Displacement: High volume without price movement is often absorption. To confirm a valid shock, the candle's high-to-low range must exceed a multiplier of the Average True Range (ATR).
Dynamic Timeframe Auto-Tuning
Different timeframes have different noise profiles. A 5-minute chart has erratic, frequent spikes, while a Daily chart's volume is more sustained. If the "Auto-adjust by Timeframe" setting is active, the script dynamically adjusts μ, α, β, and the Z-score threshold to fit the timeframe:
Low Timeframes (<= 5m): Uses a higher Z-score requirement (Z=2.0) to filter out intraday noise, with a faster decay rate.
Mid Timeframes (15m - 1H): Uses balanced parameters (Z=1.8).
High Timeframes (Daily+): Lowers the Z-score threshold (Z=1.5) but uses a higher baseline and slower decay, reflecting the longer-lasting impact of macro-level daily shocks.
How to Read the Chart
The indicator plots the λ_t line against a flat baseline (μ).
Yellow Diamonds: Mark the exact candles where a volume/ATR shock (X_t = 1) occurred.
Teal/Green Zones (Calm): The intensity is near baseline. The market is consolidating or ranging.
Orange Zones (Elevated): Multiple shocks are stacking up. The decay rate (β) cannot keep up with the new excitations (α). This is your warning that a trend or volatility expansion is initiating.
Red Zones (Expansion): The market is in a full volatility expansion. Excess intensity has crossed the critical threshold. Look for momentum continuation or impending climax depending on price action.
By tracking volume anomalies and ATR expansions through a mathematical framework known as a Hawkes Process, this indicator visualizes the buildup and decay of market intensity, giving traders a heads-up before prolonged volatility expansions.
The Mathematics: How It Works
At the core of this indicator is a discretized version of the Hawkes Process. It calculates the current market intensity (λ) at time t based on a constant baseline, the decayed intensity from previous periods, and new market shocks.
The exact formula calculated under the hood is:
λ_t = μ + (λ_{t-1} - μ) * e^(-β) + α * X_t
Here is what these variables represent in the indicator:
λ_t (Current Intensity): The total plotted excitation level of the market.
μ (Baseline Intensity, mu_eff): The constant, underlying rate of market activity when no shocks are occurring.
α (Excitation Jump, alpha_eff): The exact amount the intensity spikes when a new volume shock is detected.
β (Decay Rate, beta_eff): The speed at which the excess market excitement fades back to the baseline.
X_t (Shock Event): A boolean value (1 or 0) indicating if a volume/price shock occurred on the current candle.
Additionally, the indicator utilizes the Branching Ratio (n), defined mathematically as:
n = α / β
In quantitative modeling, if n < 1, the process is stable (shocks eventually die out). If n >= 1, the process becomes unstable and explodes. The auto-tuned parameters in this script are specifically designed to keep the branching ratio stable while remaining highly responsive to expansions.
Volume Shock Detection (X_t)
The indicator does not just fire the excitation parameter (α) on every candle. A "Shock Event" (X_t = 1) strictly occurs only when both of the following conditions are met:
Volume Z-Score: The current volume must exceed its rolling moving average by a specific standard deviation threshold.
Z = (V_t - μ_V) / σ_V
ATR Displacement: High volume without price movement is often absorption. To confirm a valid shock, the candle's high-to-low range must exceed a multiplier of the Average True Range (ATR).
Dynamic Timeframe Auto-Tuning
Different timeframes have different noise profiles. A 5-minute chart has erratic, frequent spikes, while a Daily chart's volume is more sustained. If the "Auto-adjust by Timeframe" setting is active, the script dynamically adjusts μ, α, β, and the Z-score threshold to fit the timeframe:
Low Timeframes (<= 5m): Uses a higher Z-score requirement (Z=2.0) to filter out intraday noise, with a faster decay rate.
Mid Timeframes (15m - 1H): Uses balanced parameters (Z=1.8).
High Timeframes (Daily+): Lowers the Z-score threshold (Z=1.5) but uses a higher baseline and slower decay, reflecting the longer-lasting impact of macro-level daily shocks.
How to Read the Chart
The indicator plots the λ_t line against a flat baseline (μ).
Yellow Diamonds: Mark the exact candles where a volume/ATR shock (X_t = 1) occurred.
Teal/Green Zones (Calm): The intensity is near baseline. The market is consolidating or ranging.
Orange Zones (Elevated): Multiple shocks are stacking up. The decay rate (β) cannot keep up with the new excitations (α). This is your warning that a trend or volatility expansion is initiating.
Red Zones (Expansion): The market is in a full volatility expansion. Excess intensity has crossed the critical threshold. Look for momentum continuation or impending climax depending on price action.

Aviso legal
As informações e publicações não se destinam a ser, e não constituem, conselhos ou recomendações financeiras, de investimento, comerciais ou de outro tipo fornecidos ou endossados pela TradingView. Leia mais nos Termos de Uso.
Aviso legal
As informações e publicações não se destinam a ser, e não constituem, conselhos ou recomendações financeiras, de investimento, comerciais ou de outro tipo fornecidos ou endossados pela TradingView. Leia mais nos Termos de Uso.